 Report
Fashion ecommerce statistics
How people shop for fashion online. What product pages need to explain.
Research reports
The Fotogenic AI Journal
Cart abandonment, conversion, personalization and AI figures in 23 reports. Every number links to its source.
 Start here
Product photography statistics
Read report
We couldn’t load the reports. Please try again.
Open archive Report
How people shop for fashion online. What product pages need to explain.
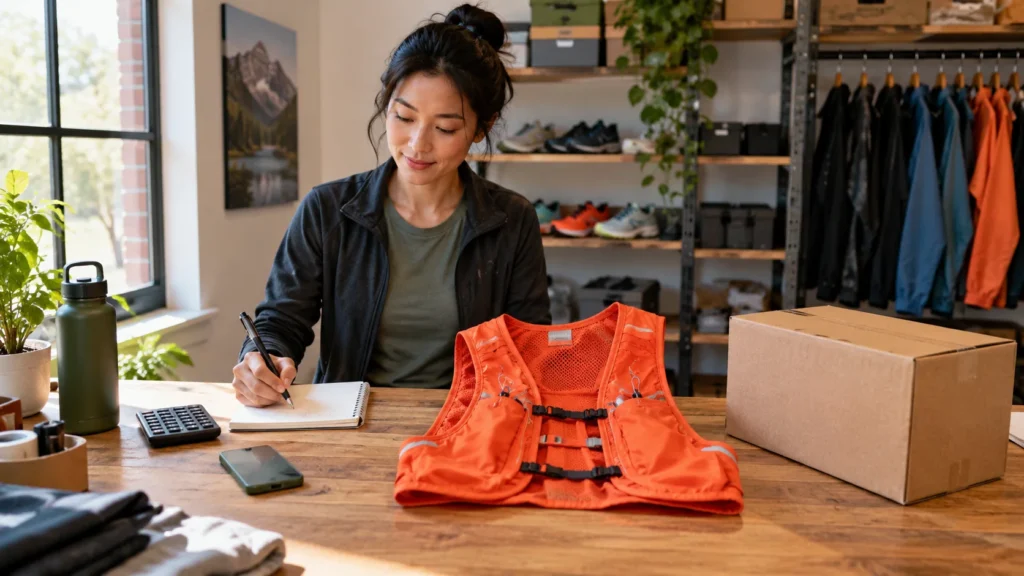
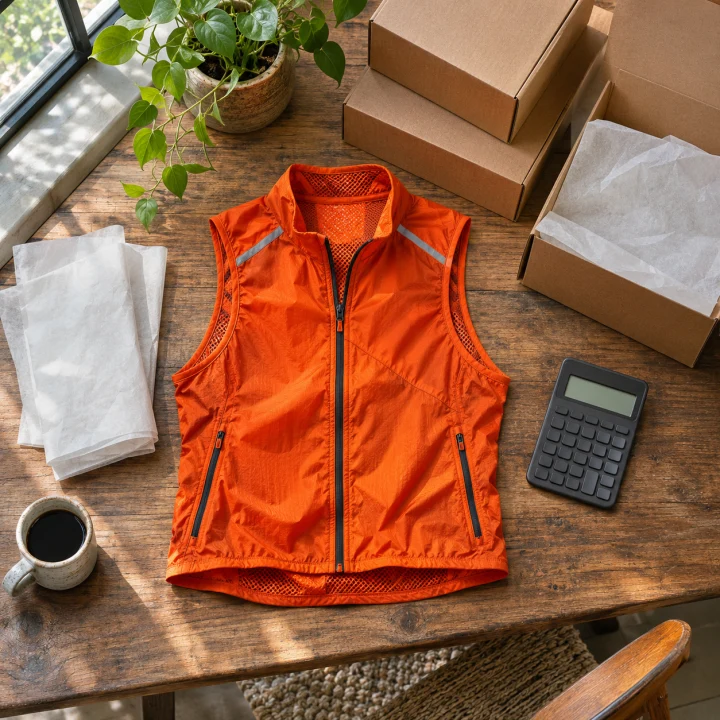
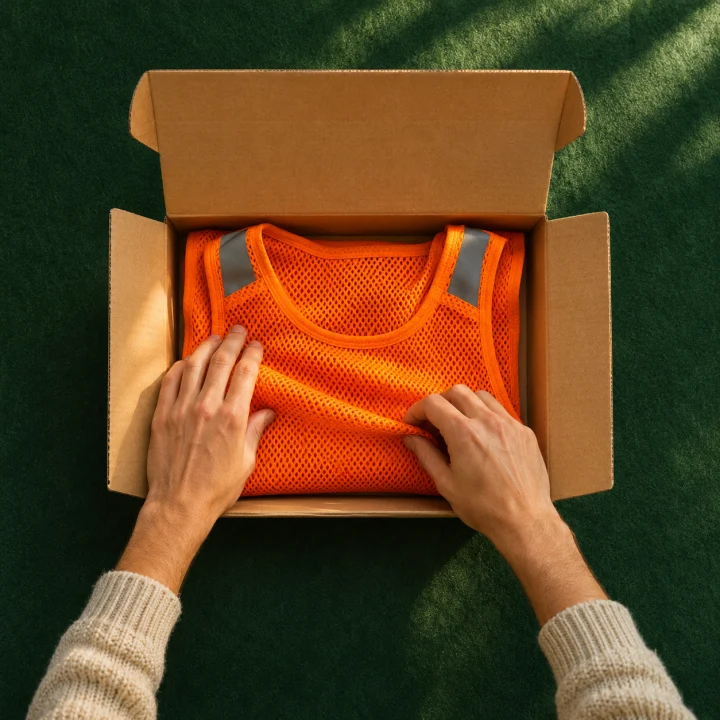 Report
Paid-media costs and customer economics. What makes acquisition sustainable.
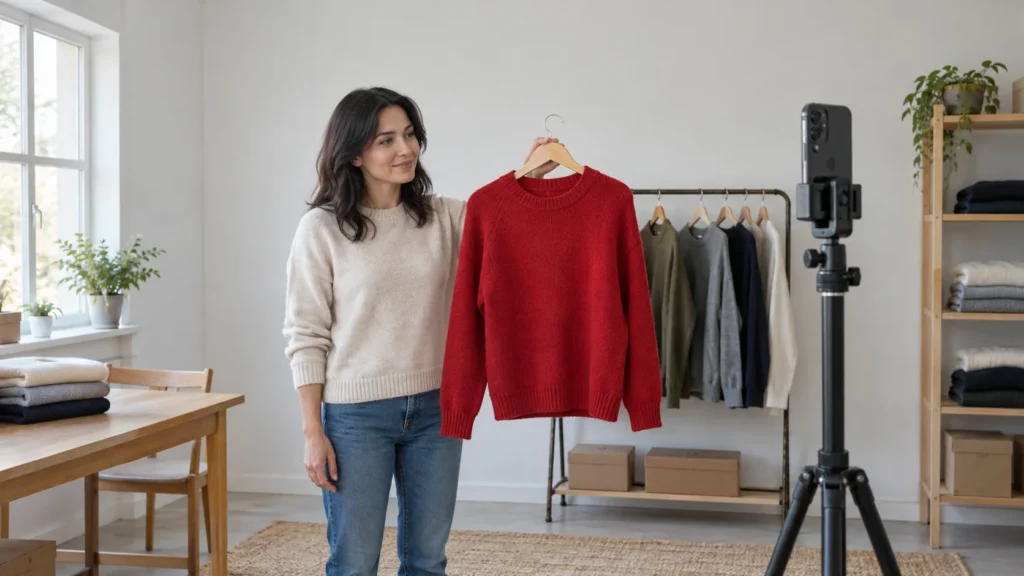
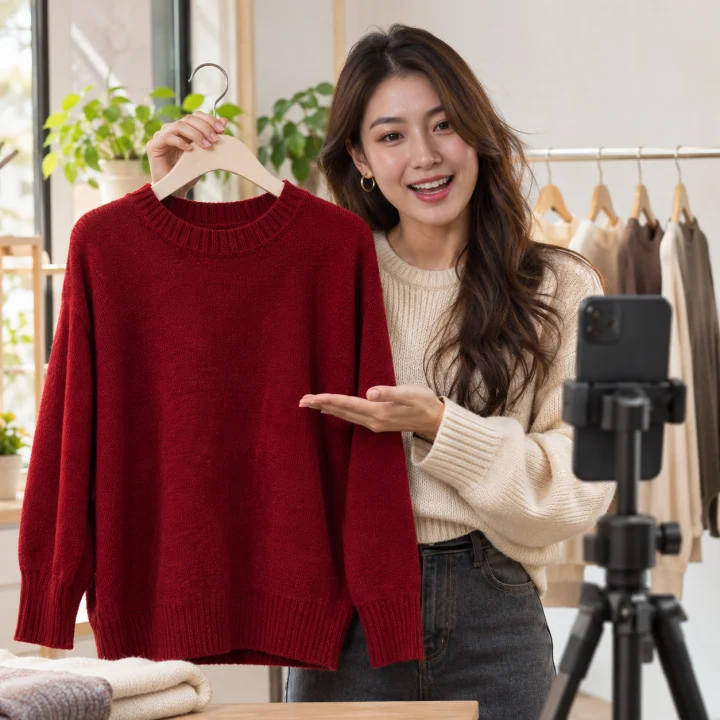
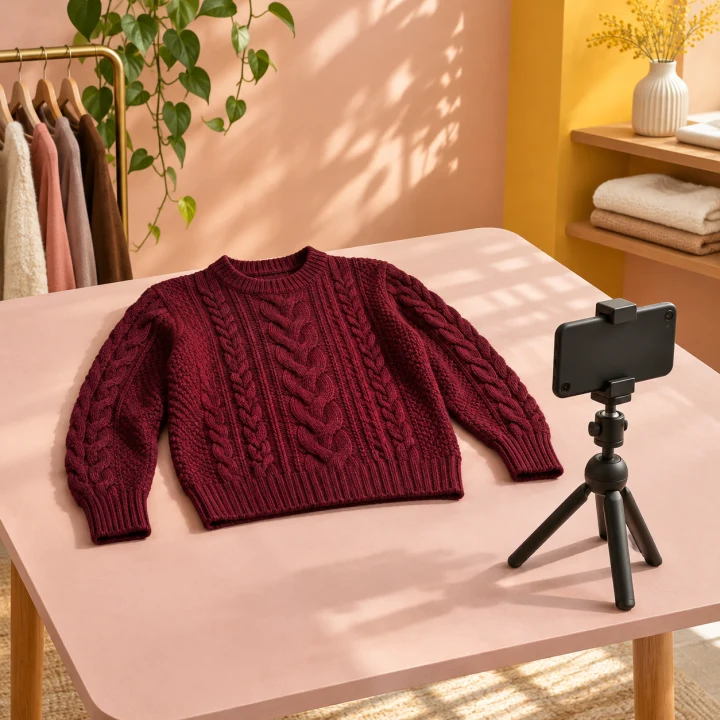 Report
How social discovery leads to shopping. What each channel can measure.
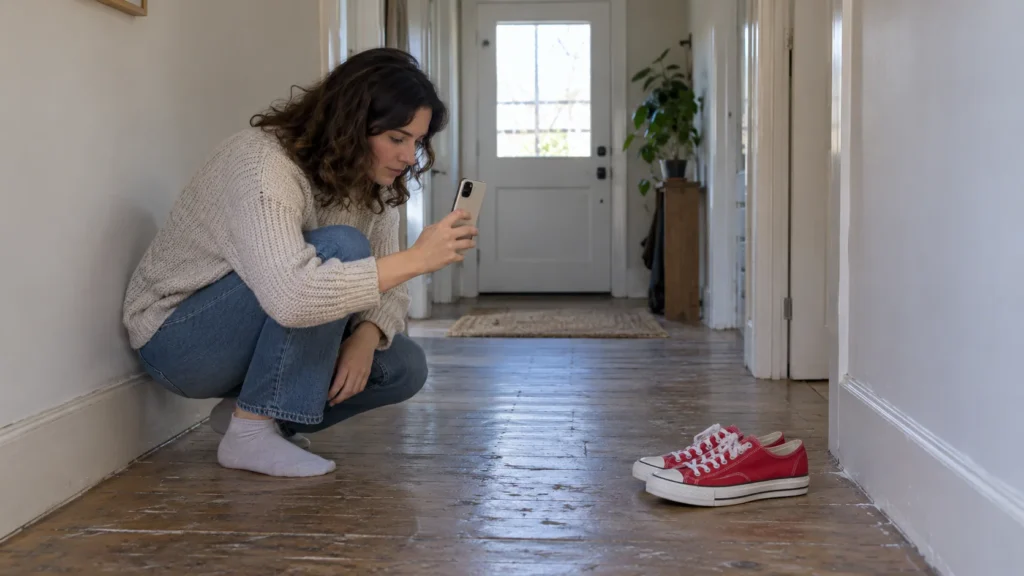

 Report
Why shoppers seek customer photos. How to make real experiences useful.
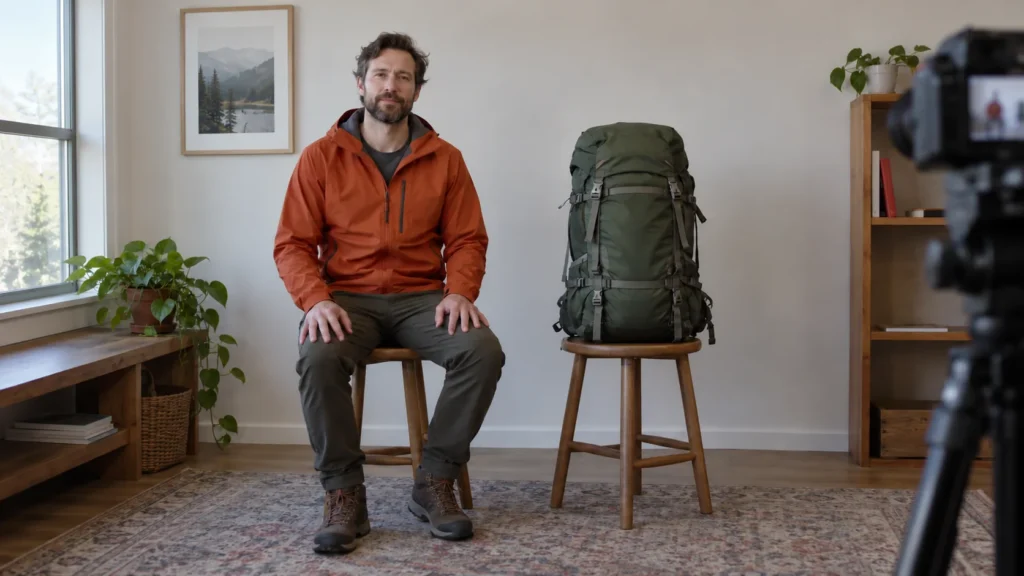
 Report
What brands look for in creators. How to evaluate the right partnership.
 Report
What makes an experience relevant. Where better customer data helps.
 Report
How teams make and share video. What a product video needs to explain.

 Report
How widely generative AI is used. Why adoption is only the beginning.
 Report
How creators earn and build audiences. What industry estimates actually count.
Why they matter
Shoppers cannot touch what they buy online, so the images do the selling.
Amazon recommends six images plus one video for a listing, and missing in-scale images showed up on 37% of the ecommerce sites in the 2026 benchmark from Baymard. Figures like these show where product photos win or lose a sale.
Looking for a number to quote? Start with product photography statistics, ecommerce conversion statistics or cart abandonment statistics.
Each report names the study, the sample and the period next to every figure, then ends with what it means for an ecommerce team.
All 23 reports in three groups. Each one is sourced and dated, ready to quote in your own work.
How images, mobile and the checkout shape a sale.
Benchmarks for the channels that bring shoppers back.
Adoption, trust and the creators shoppers follow.
FAQ
Answers on where the figures come from, how to quote them and how often each report is brought up to date.
Yes. Quote the figure with the original source named next to it, such as the study, platform report or filing. A link to the Fotogenic AI report is welcome, and it helps readers find the period and sample behind the number.
Product scenes, models and video from one photo.
Manage optional cookies for analytics, live chat, performance, and marketing. Necessary cookies stay on because the site needs them to work.
Necessary cookies are required to enable the basic features of this site, such as providing secure log-in or adjusting your consent preferences. They are not used for advertising or to track you across other sites. The consent cookie stores a random identifier that lets us keep a record of the choice you made.
Performance cookies are used to understand and analyse the key performance indexes of the website which helps in delivering a better user experience for the visitors.
Cookies that have not yet been categorized.