Fashion ecommerce statistics
How people shop for fashion online. What product pages need to explain.

Fashion ecommerce spans market demand, merchandising and fit. Start with a matched German sales-and-online-share baseline, then compare the regional shopping, resale and returns evidence for your own market.
Key takeaways
German online fashion and accessories reached an estimated EUR 21.2 billion in 2025, representing 44.2% of the same category market. [13]
Make garment information readable on a phone. Mobile devices accounted for 83% of fashion-site visits in Contentsquare's 2026 summary. [11]
Separate fit questions from color questions. The historical apparel retailer survey identified both as return reasons, requiring different product-page evidence. [9]
Key facts at a glance
German online fashion revenue
€21.2Bwas estimated German online fashion and accessories revenue in 2025.
2025 German new-fashion sales estimate
HDE and IFH KölnOnline share of German fashion
44.2%was the online share of the same German fashion and accessories market.
2025 German online share, same category
HDE and IFH KölnEU online shoppers buying fashion
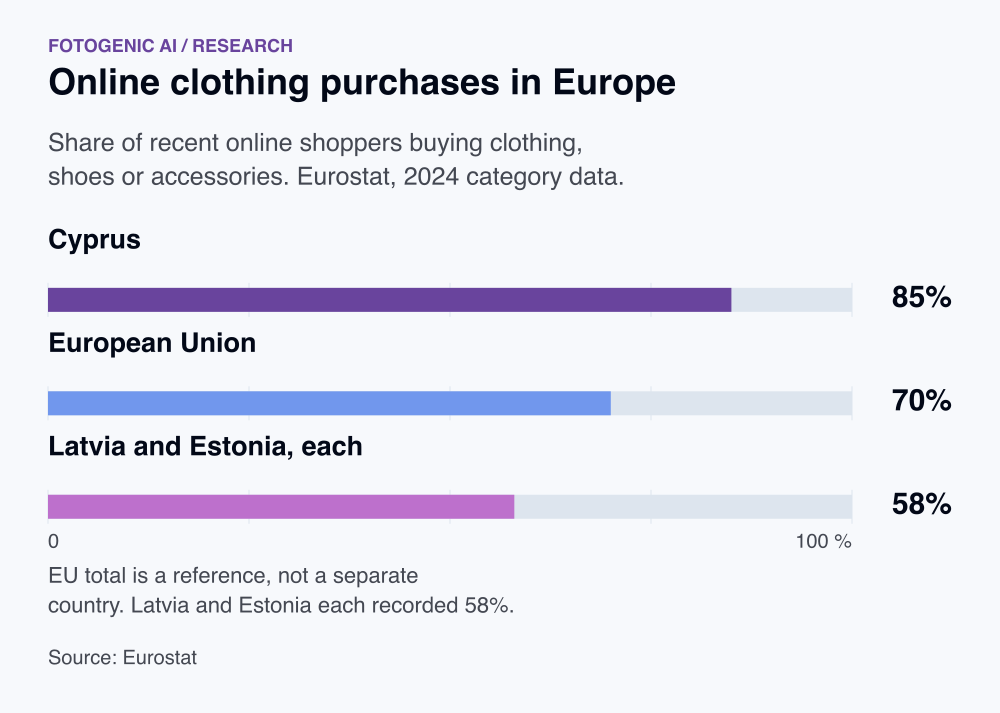
70%of recent EU online shoppers bought clothing, shoes or accessories.
2024 recent EU online shoppers
EurostatHistorical US online apparel return rate
24.4%was the estimated online apparel return rate in a 2023 US retailer survey.
Historical US retailer survey estimate, 2023
Coresight ResearchFashion visits from mobile devices
83%of fashion-site visits were mobile in Contentsquare's 2026 benchmark summary.
Fashion visits in Contentsquare 2026 summary
ContentsquareUS holiday online apparel spending
$49Bwas US online apparel spending during the 2025 holiday season.
US online apparel spend, Nov-Dec 2025
Adobe
Fashion demand and resale
70% of recent EU online shoppers bought clothing, shoes or accessories. [1]
This category measure covers 2024 purchases among people who shopped online in the preceding three months.
85% was the clothing category share in Cyprus. [1]
Country variation matters when planning localized assortments and imagery.
58% was the corresponding share in Latvia and Estonia. [1]
A lower participation share does not measure order value or annual apparel spending.
$49B was US online apparel spending during the 2025 holiday season. [2]
This covers November and December, not annual global fashion sales.
Nearly 4× was the relative growth pace of US secondhand clothing versus the broader clothing market. [3]
This describes 2025 growth rates, not a fourfold increase in resale sales.
Over 70% of forecast secondhand growth through 2030 was attributed to Gen Z and millennials. [3]
A projection about growth contribution, not their current share of all apparel purchases.
2.02% was median apparel and accessories conversion in Polar’s visible industry snapshot. [4]
Weekly Shopify-brand dashboard captured October 18, 2026. A different cohort and measure from paid-ad conversion benchmarks.
Fit, presentation and pricing
19.3% was the estimated online return rate for 2025 retail sales. [5]
Cross-category retail context, rather than an apparel-specific return rate.
23% of benchmarked sites lacked human-model imagery where applicable. [6]
This describes site implementation, not the proportion of fashion shoppers who need a model image.
5-15 thumbnails may be needed for detailed apparel and accessory evaluation in product lists. [7]
A qualitative usability recommendation from 2024, not a measured conversion increase or a minimum for every garment.
25.1% was the peak apparel discount off listed price in the 2025 US holiday analysis. [2]
Category peak, not average discount on every order, margin or year-round fashion pricing.
One third of Zalando’s returns were size-related in its company account. [8]
Share of returns, not share of orders. One retailer’s historical report; the observation window is not disclosed.
Secondhand market outlook
$78.8B was GlobalData's forecast for the US secondhand apparel market in 2030. [3]
An April 2026 market-model projection, not 2025 sales or all fashion ecommerce. The forecast includes secondhand channels beyond online-only resale.
Apparel returns and their causes
24.4% was the estimated online apparel return rate in a 2023 US retailer survey. [9]
Historical estimate for the preceding 12 months, based on 100 companies with at least $10M revenue. It is not a 2026 rate or a representative small-store benchmark.
53% of surveyed apparel decision-makers named size or fit as the top online-return reason. [9]
Share of company respondents naming a reason, not 53% of returned garments. Same sponsored 2023 survey.
16% named color as the top online apparel return reason. [9]
Company-reported reason in the same 2023 survey. The study does not isolate the effect of photography on returns.
Luxury market size and online distribution
21% was the estimated online share of the global personal-luxury-goods market in 2025. [10]
Bain estimate using information available November 18, 2025. Includes luxury categories beyond apparel. It is neither all-fashion ecommerce share nor completed 2026 sales.
€75B was Bain's midpoint estimate for global luxury apparel sales in 2025 across all channels. [10]
All channels, estimated using information available November 18, 2025. Apparel excludes footwear and leather goods. The online share for all personal luxury goods does not identify apparel ecommerce sales.
Fashion discovery and device context
83% of fashion-site visits were mobile in Contentsquare's 2026 benchmark summary. [11]
July 2026 publisher summary; fashion subsample and exact measurement window are undisclosed. This measures visits, rather than fashion sales or app purchases.
28% of surveyed US consumers reported buying secondhand apparel through social commerce. [12]
January-February 2025 survey, purchases in the preceding 12 months. Self-reported participation among 3,034 adults, not the social channel share of apparel revenue or purchases of new clothing.
39% of surveyed younger US shoppers reported a secondhand-apparel purchase through social commerce. [12]
Same 2025 study and preceding-12-month question. Younger generations means Gen Z and millennials; subgroup sample size is not disclosed. This is neither all-fashion ecommerce penetration nor current 2026 sales.
Full-year fashion market size and online share
€21.2B was estimated German online fashion and accessories revenue in 2025. [13]
Net of VAT and returns; includes clothing, shoes and leather accessories.
44.2% was the online share of the same German fashion and accessories market. [13]
Same 2025 category and market definition as the €21.2B estimate.
28.3% was internet sales share at Great Britain clothing, textile and footwear specialist stores in 2025. [14]
Store-type coverage excludes fashion sold by other retailer types; not comparable with the broader German category share.
Match the fashion market to the buying decision
The German baseline includes new clothing, shoes and leather accessories across retailer types. The British series covers specialist stores. Their different boundaries matter more than the apparent percentage gap. EU purchase participation, US holiday spending and luxury sales remain separate measures.
For garment construction and model views: write a fashion campaign brief.
Make fit information and styling work together
Use styling images to help shoppers imagine an outfit, then provide the evidence needed to understand the garment itself. Keep visible construction, fabric, hem length and included pieces consistent with the selected product. Where measurements are available, connect them clearly to the actual item.
Carry one verified garment across a campaign: review printed clothing on a model.
Keep premium styling and resale condition factual
For a premium item, show the construction and finish that explain its price: seams, hardware, lining and material texture. For a unique resale garment, photograph the actual wear and any repairs. Use a consistent inspection brief across price bands so campaign styling does not replace evidence about the specific item.
A 2030 resale forecast can inform channel planning, but it cannot set next month's stock or photography budget. Evaluate available inventory, the cost of documenting each unique item and retained contribution after returns.
Explore apparel photography for garment-specific visual production alongside the worked tutorials.
Which return problem should the gallery address?
The historical apparel survey separates size or fit from color and damage. Fit information needs measurements, construction and sizing guidance. Color needs faithful imagery and clear variant selection. Damage needs fulfillment and quality control. One attractive image cannot resolve all three.
Understand what luxury market estimates include
Bain's 2025 apparel value includes online and offline luxury sales. Its online share covers personal luxury goods across categories. Neither is an all-fashion ecommerce total. Use the EU purchase-participation and US seasonal-spending figures for their respective market questions.
Make each garment view answer a different question
For a garment page, separate style from inspection. An on-model view can show the intended styling, while the source garment supplies the evidence for fabric, print, seams and fastening. Link fit questions to measurements and the size guide; an image cannot supply missing measurements.
| Purchase question | Required evidence |
|---|---|
| Which variant is this? | The selected color and print in the first image and cart |
| How is it constructed? | Source photographs of seams, fastening and fabric detail |
| How is it styled? | A complete on-model view with the garment visible |
| Will this size work? | Item measurements, size guidance and applicable fit evidence |
FAQ
Questions about the research
Use category demand, conversion and fit-related returns together. Seventy percent of EU internet users who had bought online in the preceding three months purchased clothing, shoes or accessories in Eurostat’s 2024 category data. Polar’s October 18 snapshot gives a 2.02% apparel conversion median for its Shopify-brand cohort. Neither provides an apparel-wide return rate, and the general online retail return estimate should stay separate.
Sources and method
- Eurostat: Digitalisation in Europe 2026
ec.europa.eu
ReturnStudy details
2024 category data; 2025 online activity
EU household ICT statistics. Denominators differ by indicator.
- Adobe: 2025 holiday shopping results
news.adobe.com
ReturnStudy details
November-December 2025; January 2026 release
US online retail analytics covering over one trillion visits.
- ThredUp and GlobalData: 2026 Resale Report
newsroom.thredup.com
ReturnStudy details
April 2026 report; 2025 market activity
GlobalData market modeling and January-February 2026 surveys of 3,268 US adults and 50 top US fashion retailers/brands. Market growth contributions and 2030 sizes are forecasts; the press release mixes present and future wording, so only explicitly dated projections are used.
- Polar Analytics: Ecommerce Benchmarks: industry snapshot
polaranalytics.com
ReturnStudy details
Weekly dashboard, captured October 18, 2026
Anonymized Shopify-brand platform data; publisher describes weekly medians across thousands of brands and 16 industries. Public dashboard does not disclose exact cohort dates or per-category counts. CAC uses ad spend divided by new customers in the publisher metric directory, not fully loaded sales-and-marketing cost. Snapshot and FAQ values differ; only the visible snapshot table is cited.
- National Retail Federation: 2025 Retail Returns Landscape
nrf.com
ReturnStudy details
October 2025
US retail estimates and consumer research. Annual totals were projections.
- Baymard Institute: Product Page UX 2026: 10 Pitfalls and Best Practices
baymard.com
ReturnStudy details
March 2026 benchmark update
155+ benchmarked sites and 30,000+ manually reviewed product-page UX scores. Site prevalence, not shopper conversion.
- Baymard Institute: Product-list thumbnails
baymard.com
ReturnStudy details
November 2024 usability research
Qualitative testing in apparel/accessories and furniture/home decor. Recommended thumbnail counts are usability guidance, not an experimentally estimated sales optimum.
- Zalando Corporate: Technology and size advice
corporate.zalando.com
ReturnStudy details
Historical company results; page checked October 18, 2026
Company-reported sizing results versus items without size advice. Public article does not disclose observation window, sample or random assignment. Its July 2023 feature history is not a date for the effect estimate. Size recommendation is distinct from generative virtual try-on imagery.
- Coresight Research: The True Cost of Apparel Returns: Alarming Return Rates Require Loss-Minimization Solutions
coresight.com
ReturnStudy details
March 6, 2023 survey; April 4, 2023 publication; prior 12 months
100 senior decision-makers at US online apparel brands/retailers with at least $10M annual revenue. Sponsor: 3DLOOK. Publisher reports +/-10% margin of error. Company-reported return estimates and reasons, not order-level representative 2026 returns.
- Bain & Company and Fondazione Altagamma: Finding a New Longevity for Luxury: Luxury Goods Worldwide Market Study
bain.com
ReturnStudy details
December 18, 2025 publication; estimates based on information available November 18, 2025
Global personal luxury goods, with a separate apparel category and distribution-channel estimates. Analysis of more than 280 luxury companies/brands triangulated with trading performance, financial reports, macroeconomic data and 100-plus expert interviews. First three quarters plus expectations for Q4 2025. Not all fashion, apparel-only ecommerce or completed 2026 transactions.
- Contentsquare: UX Spotlight: Using Videos on Clothing Site's Product Pages
contentsquare.com
ReturnStudy details
Public summary updated July 30, 2026, referring to the 2026 Digital Experience Benchmarks
Original analytics publisher explicitly reports that 83% of fashion visits happen on mobile. This public summary does not disclose the eligible fashion-site count or the precise observation window for that figure. The overall 2026 benchmark methodology compares Q4 2024 with Q4 2025, but that window should not be silently assigned to an undocumented fashion subset. Traffic share is not revenue share, mobile-app share or a population census of fashion shoppers.
- HDE and IFH Köln: Online-Monitor 2026: fashion market, pages 12-13
einzelhandel.de
ReturnStudy details
Full-year 2025 estimates; 2026 report
German B2C new-goods market estimates, excluding VAT and returns. Fashion includes clothing, footwear and leather accessories. IFH combines company analysis, market extrapolation and research; not a global total.
- Office for National Statistics: KQ7B: internet sales share, textile, clothing and footwear stores
ons.gov.uk
ReturnStudy details
2025 annual estimate; release September 18, 2026
Great Britain, textile/clothing/footwear specialist retailers. Value share, not seasonally adjusted. This store-type series does not capture all fashion products sold by department stores or predominantly online retailers.
How this report uses research
This report is an editorial synthesis by Fotogenic AI, updated on October 19, 2026. Source dates describe the underlying evidence. Survey responses, measured activity and forecasts are identified separately. Findings are not combined into a new market average. Multiple pages describing one study are treated as one evidence family.
Create with Fotogenic AI
Create a coordinated garment campaign
Use Fotogenic AI to explore on-model looks and lifestyle scenes while keeping your source garment as the reference for product detail.