Product photography statistics
How shoppers use product images. What your gallery needs to show.
Product galleries need useful detail, scale and enough resolution to inspect the item. The evidence below separates shopper behavior, observed usability gaps and destination-specific production requirements.
Key takeaways
Show size as well as style. Baymard found missing in-scale imagery on 37% of evaluated ecommerce sites in its 2026 benchmark. [5]
Build the gallery around distinct purchase questions. Amazon recommends six images plus one video; the one-image minimum is only an entry requirement. [6]
Compare complete production quotes. Capture, booking access and retouching are separate services, so a low image price cannot describe the whole workflow. [7][9]
Key facts at a glance
Images and video as page priorities
61%ranked images and videos as the most important product-page elements.
2026 Salsify report; shopper stated preference
SalsifyShoppers judging size through images
42%of test users tried to judge product size through imagery.
May 2017 Baymard usability test users
Baymard InstituteBase price per ordered photograph
$39was soona's base price per ordered photograph.
USD supplier photo price, October 2026
soonaStudio booking access fee
$149was soona's Studio Pass fee per booking.
USD supplier booking fee, October 2026
soonaSites missing in-scale imagery
37%of benchmarked sites lacked in-scale product images.
Baymard 2026 evaluated ecommerce sites
Baymard InstituteRecommended images alongside one video
6images plus one video are recommended in Amazon’s image guidance.
Amazon guidance, checked October 2026
Amazon Seller Central
What shoppers inspect
61% ranked images and videos as the most important product-page elements. [1]
This is a consumer preference, not the percentage increase in sales a new gallery will produce.
56% explored product images among their first actions on a product page. [2]
Baymard reported this behavior in 2020 usability research. Treat it as evidence about inspection, not a current population estimate.
42% of test users tried to judge product size through imagery. [3]
This historical finding supports showing a familiar reference object or a product in use.
70% valued customer images for judging product quality or performance. [4]
A shopper preference from the December 2023 US survey, not measured product-page lift.
Gallery usability gaps
25% of benchmarked sites lacked sufficient image resolution or zoom. [2]
A large source image is useful only when the interface lets a shopper inspect the detail.
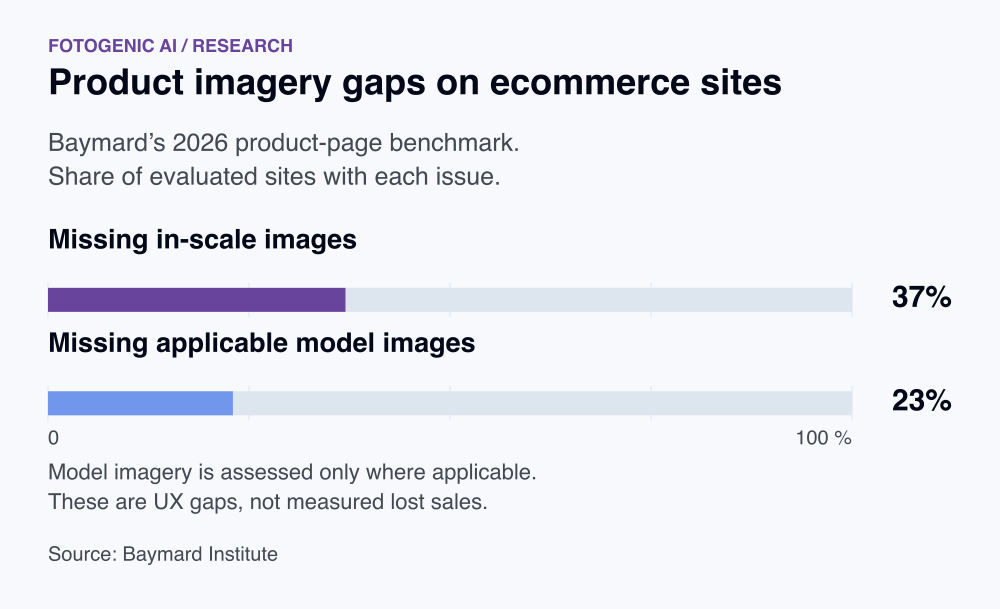
37% of benchmarked sites lacked in-scale product images. [5]
The 2026 benchmark updates the 2017 figure. Changed benchmark coverage prevents a controlled comparison over time.
23% of benchmarked sites omitted model imagery when a human model was relevant. [5]
The applicability condition matters for apparel, accessories and other worn products.
Image requirements and production costs
1 product image is the minimum for an Amazon product detail page. [6]
A marketplace listing requirement, not the recommended gallery size or a sales-performance claim.
6 images plus one video are recommended in Amazon’s image guidance. [6]
Recommendation checked October 2026. Follow the specific category rules; this does not establish a universal optimum.
$0.95 was Pixelz Professional’s advertised starting retouching price per image. [7]
Checked October 18, 2026. A $95 monthly subscription and optional services are separate; capture and creative production are not included.
3 hours was the starting turnaround advertised for custom enterprise retouching. [7]
Supplier-specific service level, subject to the agreed service. Professional instead advertises next-morning delivery.
Product information and returns
45% of surveyed shoppers had returned an online purchase because its information was incorrect or misleading. [8]
Self-reported experience in the October 2025 survey. This is a share of respondents, not a return rate or an estimate of returns caused by photography alone.
Capture prices and production scope
$39 was soona's base price per ordered photograph. [9]
Checked October 19, 2026. Studio Pass adds $149 per booking; models, styling, upgrades and premium edits are separate. Supplier quote, not an industry average.
$149 was soona's Studio Pass fee per booking. [9]
An advertised one-booking access fee, not the total shoot cost. A membership changes the access charge; ordered assets and production services remain separate.
Plan the gallery around purchase questions
A product gallery needs a deliberate sequence. Begin with a clear view of the exact item and selected variant. Follow with the information a shopper cannot establish from that view: scale, material, construction, included parts and the way the item is used. A decorative scene has a different job from a detail photograph. Treating them as interchangeable can leave a visually polished page with basic questions unanswered.
Turn unanswered product questions into a shot list: plan an ecommerce product gallery.
Compare production costs per usable deliverable
Compare complete production workflows using an agreed brief. Include preparation, capture or generation, editing, review, revisions and catalog placement. Divide that cost by approved deliverables, not by the number of files created. A low output price can hide substantial correction work.
Prepare marketplace-specific views: check Amazon product-photo requirements.
Choose a production method for each required view
Capture the source item for factual color, construction, condition and included parts. Retouching starts from those photographs and needs a defined correction scope. Generated scenes can explore presentation, but compare the output with the source before approving product details. A cost comparison should buy the same required views and approval standard.
For scheduling, record sample arrival, styling, capture, editing, review and placement separately. Supplier editing turnaround begins at a different point from a complete shoot. Confirm who handles revisions and reshoots before reserving a launch date.
Plan the full gallery with the guidance on AI product photography before commissioning individual scenes.
Price the same deliverables before choosing a workflow
Six ordered photographs at the published $39 rate plus one $149 Studio Pass total $383 before optional services. Six base-price retouches at $0.95 plus one $95 Professional month total $100.70, but require existing photographs. These calculations price different components, not equivalent finished shoots.
Use the same product list, required views and acceptance criteria when requesting a complete quote. The capture supplier sells usage rights; copyright ownership is separate. Shipping, model time, styling and the cost of correcting rejected work still need an agreed scope.
| Quote item | Capture workflow | Retouching workflow |
|---|---|---|
| Six deliverables and access | $383 published-price subtotal | $100.70 starting subtotal for one month |
| Source photographs | Captured during the booking | Must already exist; capture cost additional |
| Model and styling | Priced separately where required | Must be present in source files or separately commissioned |
| Shipping and revisions | Agree sample handling, reshoots and revision terms | Agree correction scope and source-file requirements |
| Rights and approval | Usage license; ownership buyout separate | Confirm rights to source files and required derivative use |
FAQ
Questions about the research
Amazon requires at least one product image and recommends six images plus one video. That is destination guidance, not a measured sales optimum. Build the rest of the gallery around distinct purchase questions: the selected variant, scale, material, construction and use.
Sources and method
- Salsify: Product page images and videos
salsify.com
ReturnStudy details
2026 report
Consumer survey. Stated preferences, not measured conversion lift.
- Baymard Institute: Image resolution and zoom research
baymard.com
ReturnStudy details
April 2020
Historical usability testing and website benchmarking.
- Baymard Institute: In-scale product images
baymard.com
ReturnStudy details
May 2017
Historical usability research and a 60-site benchmark.
- PowerReviews: Why shoppers value customer visuals
powerreviews.com
ReturnStudy details
December 2023; 2024 report
15,870 US consumers. Multiple-choice survey; 88% women, 55% millennials.
- Baymard Institute: Product Page UX 2026: 10 Pitfalls and Best Practices
baymard.com
ReturnStudy details
March 2026 benchmark update
155+ benchmarked sites and 30,000+ manually reviewed product-page UX scores. Site prevalence, not shopper conversion.
- Amazon Seller Central: Product image requirements
sellercentral.amazon.com
ReturnStudy details
Requirements checked October 18, 2026
Marketplace minimum and recommendation. Requirements can vary by category. This is not evidence that six images cause a particular conversion lift.
- Pixelz: Retouching pricing
pixelz.com
ReturnStudy details
Pricing checked October 18, 2026
One supplier’s advertised starting rates and service levels, not an industry average or the cost of a photography shoot. Subscription and extra services can change the total.
- Salsify: 2026 Consumer Research
salsify.com
ReturnStudy details
October 2025 survey; January 2026 release
2,712 online shoppers in the US, UK and Canada. Self-reported behavior.
- soona: Product photography and video pricing
soona.co
ReturnStudy details
Published price list checked October 19, 2026
Supplier-specific USD list prices, not a representative industry average. Studio Pass, ordered assets, models, styling, upgrades and premium editing have distinct charges. Advertised delivery is asset editing delivery, not sample-to-launch time.
- Pinterest Research: Pinterest Canvas: Large-Scale Image Generation at Pinterest
arxiv.org
ReturnStudy details
June 2026 revision; KDD 2026 accepted paper
Platform-authored research. Table 2 reports relative online A/B engagement changes for background and aspect-ratio outpainting against different original-image controls. Table 1 reports human quality checks on 996 products, two trained raters per output. No merchant sales, profit or return outcome is established. Model versions and tasks are specific to this evaluation.
- soona: Content license and ownership: legal FAQ
support.soona.co
ReturnStudy details
June 22, 2026 documentation; checked October 19, 2026
Supplier terms distinguish a purchased usage license from copyright ownership and identify a separate buyout. This is scope information for a production quote, not legal advice or an industry-wide license.
How this report uses research
This report is an editorial synthesis by Fotogenic AI, updated on October 19, 2026. Source dates describe the underlying evidence. Survey responses, measured activity and forecasts are identified separately. Findings are not combined into a new market average. Multiple pages describing one study are treated as one evidence family.
Create with Fotogenic AI
Build the views your product page needs
Use Fotogenic AI to create lifestyle scenes, on-model looks and coordinated campaign images from a product photo.