DTC acquisition benchmarks: CPA and customer cost
Paid-media costs and customer economics. What makes acquisition sustainable.

Acquisition benchmarks are useful only when the cost and customer denominator match. This report separates media CPA, ad-spend CAC for new customers and the fully loaded cost a merchant must calculate internally.
Key takeaways
Separate an attributed purchase from a new customer. Apparel benchmarks reported USD 31.64 paid-ad CPA and USD 34.03 media-only CAC from different cohorts. [1][2]
Use a category-matched cost reference. Polar's October 18 snapshot put media-only CAC at USD 54.08 for home and garden, excluding staffing and creative costs. [2]
Test the orders credited to advertising. In a study of 15 randomized ad experiments, observational models often failed to reproduce the measured experimental effects. [4]
Key facts at a glance
Median apparel paid-ad CPA
$31.64was median paid-ad CPA for apparel and accessories.
Apparel paid-ad CPA, Sep 2025-Aug 2026
Triple WhaleMedian apparel media-only CAC
$34.03was median ad-spend CAC for apparel and accessories in Polar’s snapshot.
Polar Oct 18, 2026 snapshot; media-only CAC
Polar AnalyticsMedian home and garden media-only CAC
$54.08was median ad-spend CAC for home and garden.
Polar Oct 18, 2026 snapshot; media-only CAC
Polar AnalyticsMedian home and garden paid-ad CPA
$41.95was the home and garden median CPA.
Home/garden paid-ad CPA, 2025-2026
Triple WhaleMedian beauty paid-ad CPA
$31.87was the health and beauty median CPA.
Beauty paid-ad CPA, 2025-2026
Triple WhaleMeta platform-reported median CPA
$39.24was Meta’s median platform-reported CPA.
Meta CPA, Sep 2025-Aug 2026; distinct cohort
Triple Whale
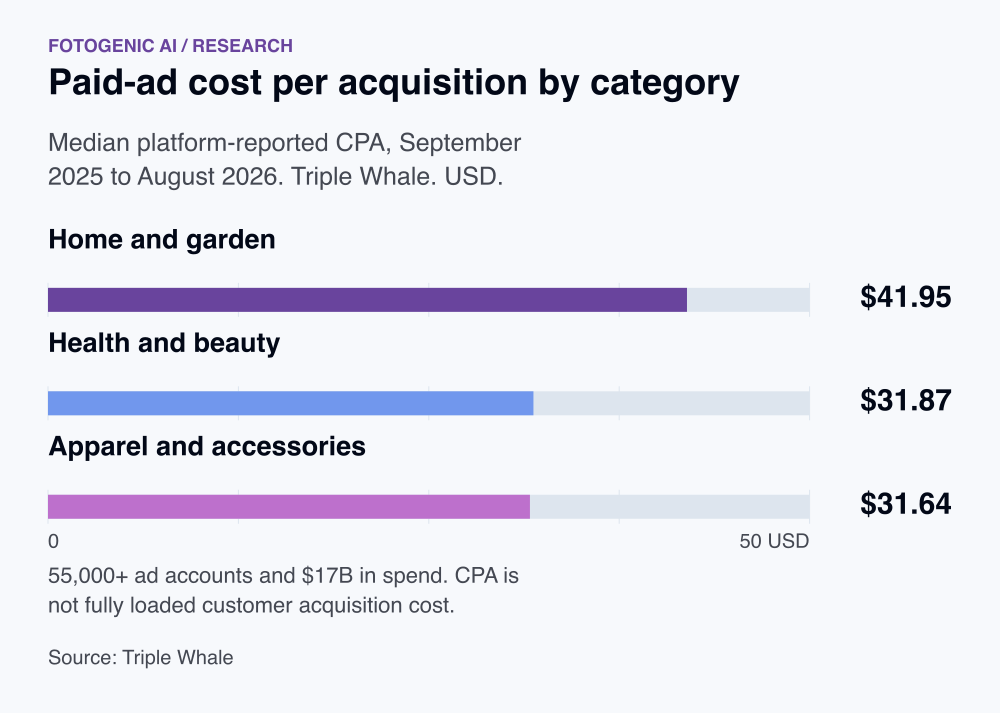
Paid-ad CPA by category
$31.64 was median paid-ad CPA for apparel and accessories. [1]
September 2025-August 2026; not fully loaded customer acquisition cost.
$31.87 was the health and beauty median CPA. [1]
A category median hides variation in products and audiences.
$41.95 was the home and garden median CPA. [1]
Compare with the same category and attribution basis.
$44.21 was the consumer electronics median CPA. [1]
Category median, not a safe spending ceiling for every business.
Paid-ad CPA by channel
$39.24 was Meta’s median platform-reported CPA. [1]
Channel cohorts differ; this is not a controlled comparison.
$28.59 was Google’s median platform-reported CPA. [1]
A purchase conversion may include a returning customer.
$16.68 was TikTok’s median platform-reported CPA. [1]
Different advertisers and attribution from other channels; not a controlled comparison.
$66.89 was AppLovin’s median platform-reported CPA. [1]
Media CPA omits staffing, creative and other acquisition costs.
Ad-spend CAC for new customers
$34.03 was median ad-spend CAC for apparel and accessories in Polar’s snapshot. [2]
October 18 dashboard snapshot. Ad spend / new customers; excludes staffing and other acquisition costs. Different cohort from the paid-ad CPA figures.
$44.29 was median ad-spend CAC for beauty and personal care. [2]
October 18 dashboard snapshot. Ad spend / new customers; excludes staffing and other acquisition costs. Different cohort from the paid-ad CPA figures.
$49.39 was median ad-spend CAC for food and beverage. [2]
October 18 dashboard snapshot. Ad spend / new customers; excludes staffing and other acquisition costs. Different cohort from the paid-ad CPA figures.
$54.08 was median ad-spend CAC for home and garden. [2]
October 18 dashboard snapshot. Ad spend / new customers; excludes staffing and other acquisition costs. Different cohort from the paid-ad CPA figures.
Traffic costs and attribution quality
9% was the year-over-year rise in cost per visit. [3]
Cross-industry traffic cost. It does not measure the cost to acquire a new paying customer.
30% was the cumulative rise in cost per visit over three years. [3]
A multi-year comparison, not an annual growth rate or a forecast.
15 randomized advertising experiments were compared with observational models in a measurement study. [4]
Historical Facebook experiments. Observational models often did not recover experimental effects; attribution is not automatically incrementality.
Commerce media and channel context
$63.4B was US commerce-media advertising revenue in IAB and PwC’s 2025 report. [5]
Industry media revenue, not DTC customer acquisition spending or product sales. The report covers commerce media beyond traditional retailer-site placements.
Define CPA and CAC before comparing costs
Paid-ad cost per acquisition often uses a platform-attributed purchase as its denominator. Customer acquisition cost should use verified new customers and an explicitly defined cost base. A repeat purchase credited to an advertisement can lower CPA without reducing the cost of gaining a new customer.
Include creative preparation in acquisition costs: plan controlled creative variations.
Connect acquisition to contribution and payback
Assess acquisition cost against the contribution the customer produces over a defined period. Account for refunds, discounts and variable fulfillment costs where they belong in the business model. Revenue alone can hide the difference between a profitable order and an expensive promotional purchase.
Create a controlled ad treatment: build product-photo ad creative.
Allocate creative cost before calculating payback
Keep acquisition-only production costs separate from assets reused by retention campaigns. Decide an allocation rule before evaluating a channel, then use the same rule across periods. Charging the entire library to one month and none to the next can make CAC move without a change in media efficiency.
Meta’s creative training treats diversification as variation in format, visuals and message. Build a distinct product question or audience context into a new concept, then account for its production cost. A rise in CAC alone does not identify creative fatigue: inspect delivery, audience mix, tracking and the purchase journey before commissioning more assets.
Include product ad imagery in acquisition cost when that production cost belongs to the tested campaign.
Include the cost of a completed social order
A native social order can carry referral fees, creator commissions, campaign fees and logistics charges in addition to paid-media cost. Attribute these consistently and reconcile refunds before comparing contribution and payback with a store-site campaign. Published category fees are inputs, not a blended CAC benchmark.
Calculate allowable CAC and contribution payback
Set a contribution horizon before judging acquisition cost. Deduct the variable costs and refunds associated with those orders; keep acquisition spend outside that contribution figure to avoid subtracting it twice.
Payback is the earliest point at which a cohort’s cumulative contribution covers its acquisition cost. Use observed cohort cash flows when orders are uneven; a fixed monthly-average shortcut can obscure the timing.
| Measure | Definition | Boundary |
|---|---|---|
| Fully loaded CAC | Included acquisition spend / new customers | Matching period and cost allocation |
| Contribution before acquisition | Net order revenue minus variable order costs | Include returns and refunds consistently |
| Allowable CAC | Horizon contribution minus required retained contribution | Explicit horizon and cash constraint |
| Payback | First point cumulative contribution covers CAC | Cohort cash flows, not revenue ROAS |
Compare retailer media with your own store
Commerce-media market size describes the advertising channel, rather than the acquisition cost a merchant can afford. Reconcile product costs, marketplace charges, fulfillment, refunds and advertising for the orders being compared.
Amazon’s documented new-to-brand purchase measure looks back 12 months for a brand purchase. It does not establish that every attributed shopper is a first-ever customer across all channels. Keep the platform classification, the store’s customer record and incremental orders separate.
Put a published creative cost into the acquisition ledger
The six-photo capture subtotal in the product-photography report is $383 from published charges. If that production is wholly commissioned for acquisition, $383 belongs in the chosen acquisition cost base. If assets also serve other work, allocate the cost consistently. Shipping, model time, review labor and revisions still need their actual costs.
That invoice input cannot establish payback without a real customer cohort. Follow verified first purchases, refunds and later orders for a defined horizon. A larger order value repays acquisition only through the contribution retained after the order’s variable costs.
| Ledger decision | Recorded treatment |
|---|---|
| Customer denominator | Deduplicated first-time customers from the store record |
| Creative production | Assigned production charges plus review and revision labor |
| Other acquisition costs | Media, partner and acquisition-team costs under the same allocation rule |
| Retained cohort contribution | Net order revenue less product, payment, fulfillment and returns costs |
| Payback decision | First date cumulative retained contribution covers included acquisition spend |
Test a creative question before declaring fatigue
Compare a garment-detail concept with an existing style-led concept under the same offer and eligible audience. Record the concept, format, source product, production cost and assignment method. Assess qualifying new customers and retained contribution. A change in click-through rate alone does not establish lower CAC, and rising CAC alone does not identify fatigue.
FAQ
Questions about the research
Polar’s October 18 snapshot reported ad-spend CAC medians of $34.03 for apparel and accessories and $54.08 for home and garden. Its definition is ad spend divided by new customers. Fully loaded CAC must also include the chosen acquisition costs, such as creative and labor, and should be assessed against observed customer contribution and payback.
Sources and method
- Triple Whale: CPA benchmarks by industry and channel
triplewhale.com
ReturnStudy details
September 2025-August 2026
55,000+ ad accounts, $17B spend. Platform-reported median CPA, not fully loaded CAC.
- Polar Analytics: Ecommerce Benchmarks: industry snapshot
polaranalytics.com
ReturnStudy details
Weekly dashboard, captured October 18, 2026
Anonymized Shopify-brand platform data; publisher describes weekly medians across thousands of brands and 16 industries. Public dashboard does not disclose exact cohort dates or per-category counts. CAC uses ad spend divided by new customers in the publisher metric directory, not fully loaded sales-and-marketing cost. Snapshot and FAQ values differ; only the visible snapshot table is cited.
- Contentsquare: 2026 Digital Experience Benchmarks: acquisition costs
contentsquare.com
ReturnStudy details
2026 report; 2025 activity
More than 99 billion sessions and 6,500 websites across industries; comparison is Q4 2024 versus Q4 2025. Cost per visit is not customer acquisition cost or a DTC-only benchmark.
- Gordon and coauthors / INFORMS: A Comparison of Approaches to Advertising Measurement
pubsonline.informs.org
ReturnStudy details
2019 publication
15 US Facebook randomized advertising experiments; 500 million user-experiment observations, not unique people. Compares observational estimates with experimental effects, not a present-day channel CPA benchmark.
- IAB and PwC: Internet Advertising Revenue Report: Full Year 2025
iab.com
ReturnStudy details
2025 US advertising revenue; April 16, 2026 release
US industry revenue measurement based on publisher information and public corporate data, with PwC research and estimation. Commerce media includes activity beyond retailer-site placements. Not DTC-only spending, merchant sales, a CAC benchmark or an audited set of individual-company accounts. Category revenues can overlap other advertising classifications.
- Polar Analytics: Metric Directory: CAC definition
support.polaranalytics.com
ReturnStudy details
Updated September 17, 2026
Publisher documentation defines CAC as ad spend divided by number of new customers. This establishes the metric definition, not a new independent performance study.
- Meta Blueprint: Ad creative that converts: how to diversify your ads for better results
facebookblueprint.com
ReturnStudy details
May 18, 2026 training description; checked October 19, 2026
Official training describes varying formats, visuals and messages and producing creative from existing assets or creators. Guidance, not a randomized effect-size study or a universal monthly asset quota.
- TikTok Shop Academy US: TikTok Shop Referral Fees in 2024 by Category
seller-us.tiktok.com
ReturnStudy details
Table updated May 14, 2026; checked October 19, 2026
Public US category fee schedule, despite historical title. Listed category referral rate is not all-in selling cost. Seller-specific promotions, category differences, fulfillment, affiliate and advertising charges need separate checks. Not a global fee schedule.
- TikTok Shop Academy UK: Guidebook: Understanding Financial Statements
seller-uk.tiktok.com
ReturnStudy details
Current financial statement guide checked October 19, 2026; service fee effective July 15, 2026
UK seller settlement documentation. The 3PL Shipped-by-Seller fee has fulfillment-method conditions and exemptions. Commission, creator fees, campaign charges and logistics are separate statement lines. Not a global rate or a seller profit estimate.
- Shopify: Ecommerce customer acquisition: channels and formula
shopify.com
ReturnStudy details
July 1, 2026 guidance; checked October 19, 2026
First-party educational definitions for acquisition spend, new customers, contribution and payback. The formulas below are accounting definitions, not an industry benchmark or a prediction of returns.
- Amazon Ads: Benchmark reporting
advertising.amazon.com
ReturnStudy details
October 6, 2026 documentation update; checked October 19, 2026
Official advertising metric definitions. New-to-brand purchases concern shoppers without a brand purchase in the preceding 12 months under the documented reporting scope. A platform attribution classification is separate from lifetime customer acquisition and causal incrementality.
- soona: Product photography and video pricing
soona.co
ReturnStudy details
Published price list checked October 19, 2026
Supplier-specific USD list prices, not a representative industry average. Studio Pass, ordered assets, models, styling, upgrades and premium editing have distinct charges. Advertised delivery is asset editing delivery, not sample-to-launch time.
How this report uses research
This report is an editorial synthesis by Fotogenic AI, updated on October 19, 2026. Source dates describe the underlying evidence. Survey responses, measured activity and forecasts are identified separately. Findings are not combined into a new market average. Multiple pages describing one study are treated as one evidence family.
Create with Fotogenic AI
Create variations for a defined acquisition test
Prepare product ad concepts in Fotogenic AI, then include production and review costs when you evaluate the campaign.