Ecommerce personalization statistics
What makes an experience relevant. Where better customer data helps.
Personalization has to connect reliable product and customer context with a useful recommendation. The evidence separates capability and consumer expectations from a historical controlled recommender result.
Key takeaways
Begin with a usable customer signal. In Salesforce's cross-industry survey, 98% of marketers reported personalization barriers and only 51% had complete commerce-data access. [1]
Choose recommendations that answer the next shopping question. Pinterest's historical ItemSage experiment measured a 6.85% relative GMV-per-user lift on Closeup. [6]
Respect the preference the customer actually shared. In Attentive's subscriber survey, 48% associated personalized marketing with using their stated preferences. [7]
Key facts at a glance
Marketers facing personalization barriers
98%of marketers reported barriers to personalization.
Oct-Nov 2025 cross-industry marketer survey
SalesforceBusinesses reporting AI personalization
63%of DHL-surveyed businesses reported AI personalization experiences.
2026 DHL business self-report
DHL eCommerceRelative GMV lift in a recommendation test
6.85%relative GMV-per-user lift followed ItemSage recommendations on Pinterest Closeup.
2022 Pinterest A/B test; relative GMV lift
Pinterest ResearchConsumers expecting personalized interactions
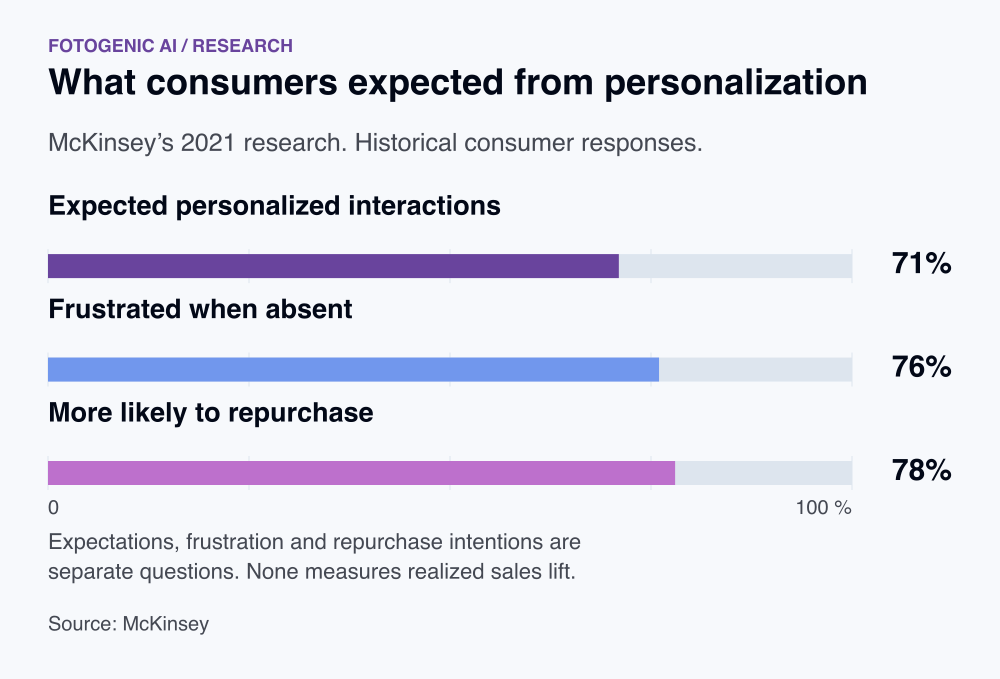
71%of consumers expected personalized interactions in McKinsey’s research.
Historical 2021 consumer expectations
McKinseyConsumers frustrated by missing personalization
76%felt frustrated when personalization was absent.
Historical 2021 stated frustration
McKinseyPersonalization and stated repurchase intention
78%said personalized content made them more likely to repurchase.
Historical 2021 stated repurchase intention
McKinsey
Capability and data barriers
98% of marketers reported barriers to personalization. [1]
The survey spans industries, not only online retail.
51% had complete access to commerce data. [1]
Incomplete context can limit useful recommendations.
84% reported running generic campaigns. [1]
AI adoption does not automatically produce relevant messaging.
69% struggled to respond promptly to customers. [1]
A conversation needs operational follow-through.
50.9% of loyalty program owners offered AI-driven personalization. [2]
A separate loyalty survey measures reported capability, not effectiveness.
63% of DHL-surveyed businesses reported AI personalization experiences. [3]
Page 30, business feature question. This is reported capability, not a measured revenue effect.
Consumer expectations and privacy
71% of consumers expected personalized interactions in McKinsey’s research. [4]
Historical 2021 evidence, not a new 2026 survey.
76% felt frustrated when personalization was absent. [4]
Consumer sentiment does not establish a specific revenue penalty.
78% said personalized content made them more likely to repurchase. [4]
Stated intention, not observed repeat-purchase lift.
27% of surveyed consumers refused to share data with AI agents, even for a more personalized experience. [5]
US/UK consumer survey, late 2025. Stated preference, not all global shoppers or an observed consent rate.
Measured recommendation outcomes
6.85% relative GMV-per-user lift followed ItemSage recommendations on Pinterest Closeup. [6]
Historical 2022 platform experiment, relative to the prior recommender. GMV is not contribution profit.
5.13% relative lift in average checkouts per user occurred in that Closeup experiment. [6]
Same experiment as the GMV finding. These are linked outcomes, not independent corroborating studies.
Relevant recommendations and stated preferences
73% of surveyed messaging subscribers said relevant product suggestions made purchase more likely. [7]
February 2026 subscriber survey. Self-reported likelihood, not a 73% conversion rate or measured recommendation lift.
48% said marketing felt personalized when it used preferences they had shared. [7]
Examples included size, style and interests. A multiple-response perception question, not permission for every data use or proof of incremental revenue.
Start with reliable context, not more variations
Record the inputs a rule needs, who supplies them and when they expire. Product availability and the selected variant should be current at the point of use. A preference supplied by a customer has a different origin from an inference based on browsing.
Prepare the relevant product variation: explore image variations.
Match the personalization tactic to available information
Choose the input and missing-data behavior together. The following planning map distinguishes an item recommendation from a change to message timing or creative.
| Tactic | Input | Fallback |
|---|---|---|
| Item recommendations | Relevant behavior and eligible stock | Available category selection |
| Message timing | Subscribed channel and event state | Suppress an ineligible trigger |
| Visual variant | The selected product and permitted context | Accurate general product view |
| Preference-based offer | Preferences the customer supplied | General offer with the same terms |
Use product ad imagery for the approved creative; recommendation rules stay in the commerce platform.
Measure one personalization decision at a time
Assign eligible visitors to a stable control where practical. Define purchase, contribution and return outcomes before launch, and keep product availability and the observation window consistent.
In the video trial, purchase histories informed the message and human marketers controlled scripts. Comparing personalized video with generic video changes relevance as well as production. Comparing it with personalized images also changes format. Select the baseline that isolates the decision your store is making.
Approve product detail before changing placement: keep catalogue product details consistent.
Specify a preference-based garment recommendation
Use a style preference the shopper supplied and current eligible stock to choose the recommendation. Test that ranking against a general in-stock category selection. Keep price, offer and product photography unchanged so the result answers a recommendation question.
A visual-context test is different: keep the recommended item fixed and compare a general product scene with a context-specific scene. Fotogenic AI can supply the creative assets; the store or messaging system owns audience selection, consent and delivery.
| Decision | Specification |
|---|---|
| Inputs | Customer-supplied style preference and current product/variant availability |
| Fallback | General in-stock selection when a preference is missing or the chosen item is unavailable |
| Assignment | Keep each eligible shopper in a stable treatment or control |
| Asset check | The same garment, selected color and accurate product detail in either context |
| Evaluation | Purchases and retained contribution per eligible shopper, with relevant returns followed through |
FAQ
Questions about the research
A historical Pinterest ItemSage A/B experiment on its Closeup surface reported 6.85% higher GMV per user and 5.13% more checkouts per user versus its prior recommendation baseline. That is controlled evidence for a particular recommender change, rather than a universal merchant uplift. Evaluate relevance, product availability and contribution after costs in your own rule test.
Sources and method
- Salesforce: State of Marketing 2026
salesforce.com
ReturnStudy details
October 8-November 17, 2025 survey; February 19, 2026 release
Double-anonymous survey of 4,450 marketing decision makers across North America, Latin America, Asia-Pacific and Europe. Marketer perceptions, not consumer behavior or an ecommerce-only census. Performance categories describe satisfaction with marketing outcomes.
- Antavo: Global Customer Loyalty Report 2026 findings
antavo.com
ReturnStudy details
2026 report
3,000 professionals, 10,000 loyalty members and a separate platform activity dataset. Multiple public pages describe this same research; they are one evidence family, not independent corroboration.
- DHL eCommerce: 2026 E-Commerce Trends Report, full research and methodology
dhl.com
ReturnStudy details
Fieldwork December 2025-February 2026
29,000 recent online shoppers in 29 countries and 5,800 businesses in 28 countries; 1,000 shoppers per country. Grocery, tickets and flights excluded. Shopper and business responses are distinct. Cited findings appear on pages 5, 30 and 42; methodology is on page 78. The try-on/fit interest measure on page 42 concerns only the app-first shopper subgroup. Self-reported adoption, reasons and preferences do not establish transaction outcomes.
- McKinsey: Consumer expectations for personalization
mckinsey.com
ReturnStudy details
November 2021 publication
Historical consumer survey findings. Expectations and stated purchase intentions do not establish realized revenue lift. The article does not expose full sample details in its text.
- Braze: 2026 Global Customer Engagement Review
braze.com
ReturnStudy details
Surveys November-December 2025; published February 2026
Separate surveys of 2,200 marketing executives at B2C companies with at least $10M annual revenue and 4,000 US/UK consumers. Behavioral dataset: 779 customers during 2025. Consumer trust answers are stated intent, not measured churn.
- Pinterest Research: ItemSage: Learning Product Embeddings for Shopping Recommendations at Pinterest
arxiv.org
ReturnStudy details
2022 paper
Table 4: platform A/B tests replacing candidate-generation embeddings on Home, Closeup and Search. Relative changes compared with the specified prior embedding baselines. Historical platform-specific recommender evidence; not a universal personalization, image-generation or merchant profit benchmark.
- Attentive: 2026 personalization and subscriber expectations
attentive.com
ReturnStudy details
February 23, 2026 consumer survey; September article update
Pollfish online survey of 1,050 US, UK and Australian consumers aged 18-79, who shopped online in the previous three months and opted into at least email or text marketing. Four generations contribute equally, with no other post-stratification. Questions span messaging channels, not SMS alone. Separate April consumer and marketer data on the page are not combined with these findings.
- MIT Initiative on the Digital Economy, summarizing Kapoor and Kumar: Can Generative AI Create Low-Cost Personalized Video Ads That Engage Consumers?
ide.mit.edu
ReturnStudy details
2025 research brief; paper published May 8, 2025; exact experiment dates not disclosed in brief
Randomized single-exposure WhatsApp field experiment with 21,328 recipients of one Indian DTC retailer. Personalized avatar videos used purchase histories; baselines were personalized images and generic videos. CTR is engagement, not sales or profit. Production-cost estimates are back-of-envelope and excluded here.
How this report uses research
This report is an editorial synthesis by Fotogenic AI, updated on October 19, 2026. Source dates describe the underlying evidence. Survey responses, measured activity and forecasts are identified separately. Findings are not combined into a new market average. Multiple pages describing one study are treated as one evidence family.
Create with Fotogenic AI
Prepare the creative for a relevant product context
Use Fotogenic AI to create scenes and image variations for a selected product. Apply recommendation and audience rules in your commerce system.