Social commerce statistics
How social discovery leads to shopping. What each channel can measure.

Social commerce can finish inside a platform or at a retailer’s checkout. Native TikTok Shop GMV estimates, company-reported sales and retailer-site attribution provide distinct measures of that activity.
Key takeaways
Size the channel you actually sell through. Researchers estimated 2025 TikTok Shop GMV at USD 15.1 billion in the US and USD 64.3 billion across 16 markets. [11]
Plan the content format within its market. Livestreams accounted for an estimated 14% of US TikTok Shop GMV in 2025; format share does not measure incremental lift. [11]
Follow the order beyond the social click. The published US referral rate for women's dresses and tops was 6%, before other applicable selling costs. [9]
Key facts at a glance
Estimated US TikTok Shop GMV
$15.1Bwas estimated US TikTok Shop GMV in 2025.
2025 US native-shop GMV estimate
Momentum Works and TabcutEstimated TikTok Shop GMV across 16 markets
$64.3Bwas estimated TikTok Shop GMV across 16 markets in 2025.
2025 native-shop estimate across 16 markets
Momentum Works and TabcutCompany-reported four-day BFCM sales
Over $500Min US TikTok Shop sales was reported during the four-day 2025 BFCM weekend.
US four-day BFCM sales, 2025 company report
TikTok NewsroomEstimated US livestream share of Shop GMV
14%was livestreams’ estimated share of US TikTok Shop GMV in 2025.
2025 US format-share estimate, not causal lift
Momentum Works and TabcutUS holiday retailer-site revenue from social
4.6%was social-attributed revenue’s share of US holiday retailer-site online revenue in 2025.
US retailer-site attribution, Nov-Dec 2025
AdobeUS referral fee for dresses and tops
6%was the published US TikTok Shop referral rate for women's dresses and tops.
US category referral fee, checked October 2026
TikTok Shop Academy US
Discovery and channel adoption
52% of surveyed shoppers discovered new products through social media. [1]
Discovery is not the same as purchasing inside a social platform.
7 in 10 shoppers reported purchasing through social media. [2]
The 2025 survey covered recent online shoppers across 24 markets.
72% of EU internet users participated in social networks in 2025. [3]
Participation is a reach indicator, not a commerce conversion measure.
45% of ad buyers expected to increase focus on shoppable ads in 2026. [4]
This measures planned resources, not resulting sales.
45% of DHL-surveyed shoppers identified as having bought through TikTok, Instagram or Facebook. [5]
Page 5, 2026 shopper-type statement. Different question from the 2025 survey; not a trend comparison or proof of native in-app checkout.
63% of DHL-surveyed businesses offered selling through social media. [5]
Page 5, business channel responses. Separate population from shopper adoption; reported availability is not revenue share.
Revenue and platform outcomes
3.3% was social media’s share of US holiday online revenue in 2024. [6]
Adobe’s channel attribution on retailer sites, not in-app social checkout GMV.
4.6% was social-attributed revenue’s share of US holiday retailer-site online revenue in 2025. [6]
Same holiday-period channel measure; it is not the social discovery rate.
84% sales growth was reported for US TikTok Shop sellers hosting livestreams during BFCM 2025. [7]
Year-over-year platform-reported campaign result. Seller mix and campaign length differ; this is not a randomized livestream effect.
Platform audience context
50% of US adults reported ever using Instagram in Pew’s 2025 survey. [8]
Platform use, not shopping, daily activity or reachable advertising audience.
37% of US adults reported ever using TikTok. [8]
Weighted survey of 5,022 adults. Neither native checkout adoption nor transaction frequency.
Native social shopping and regional context
Nearly 50% more shoppers bought on TikTok Shop in the US during its 2025 BFCM campaign than in 2024. [7]
Platform-reported campaign comparison: November 12-December 1, 2025 versus November 13-December 2, 2024. It is buyer growth, not four-day sales growth or global market share.
66% of DHL-surveyed Asia-Pacific shoppers identified as having bought through social media. [5]
Page 5 regional shopper profile. Channels include TikTok, Instagram or Facebook; the question does not isolate native checkout from referred shopping.
Native social-commerce fees by market
6% was the published US TikTok Shop referral rate for women's dresses and tops. [9]
Category schedule checked October 19, 2026, updated May 14. This is a referral fee, not all-in selling cost; promotions and other charges can differ.
£0.50 per package was the listed UK 3PL Shipped-by-Seller service fee. [10]
VAT-inclusive, effective July 15, 2026. Guide conditions and exemptions include Fulfilled by TikTok and Shipped via Platform. This is separate from commission.
Native-checkout sales and format mix
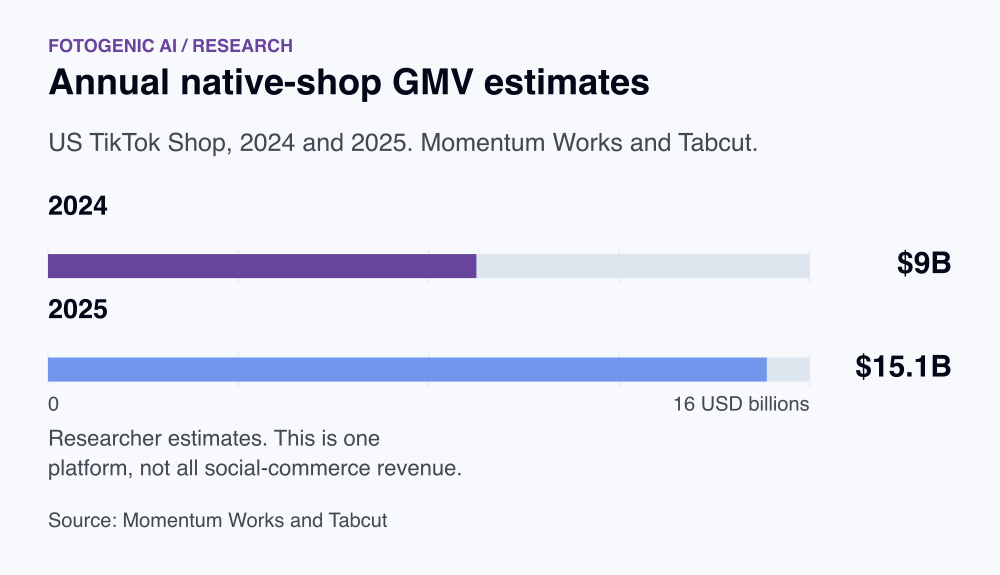
$15.1B was estimated US TikTok Shop GMV in 2025. [11]
Researcher estimate, not audited platform revenue or all US social commerce.
$9B was the same researchers’ estimate of US TikTok Shop GMV in 2024. [11]
Comparable annual platform series; public refund treatment is not disclosed.
$64.3B was estimated TikTok Shop GMV across 16 markets in 2025. [11]
The 16-market estimate includes the US figure and excludes other social platforms.
Over $500M in US TikTok Shop sales was reported during the four-day 2025 BFCM weekend. [7]
Company-reported native sales, distinct from its longer campaign-period buyer comparison.
14% was livestreams’ estimated share of US TikTok Shop GMV in 2025. [11]
The same study assigns 50% to video and 36% to the Shop tab; channel share is not incremental lift.
Distinguish discovery from a completed transaction
Discovering a product on social media, clicking through to a store and buying inside a platform are separate behaviors. The percentages here come from different questions and populations. They should not be read as consecutive stages of one measured funnel.
Carry the same item into the campaign: plan a product-photo ad.
Choose the market and checkout route
The purchase destination changes what a seller needs to operate. These routes were checked on October 19, 2026. TikTok’s European row describes its May announcement of a June launch, rather than an exhaustive current country list.
For website checkout, preserve the product, variant and offer after the social click. Check the journey inside an in-app browser, including sign-in, payment and a route back to browsing. For a native shop, confirm seller eligibility, catalog rules and settlement terms before preparing the campaign.
| Selling route | Market or eligibility scope | Purchase destination | Costs to check |
|---|---|---|---|
| TikTok Shop, US | Approved US seller and eligible category | In-app TikTok Shop checkout | Category referral fee; creator, fulfillment and ad costs separately |
| TikTok Shop, European expansion | Austria, Belgium, Netherlands and Poland named for June 15, 2026 | In-app TikTok Shop checkout | Applicable market seller terms, affiliate and logistics costs |
| Facebook/Instagram via Shopify | Supported market and approved channel/products | Merchant’s Shopify checkout | Store checkout/payment costs; paid campaigns when used |
| Pinterest Product Pins | Merchant-compliant products purchasable on own site | Merchant website; some formats can link to own app | Free organic listing, no Pinterest sales commission; optional ads and own-store costs |
Match the social destination to the selected variant: prepare the matching Shopify product gallery.
Compare contribution after the applicable charges
US TikTok category referral fees and UK fulfillment charges buy different services. The US schedule lists 6% for women’s dresses and tops; the UK guide separately identifies commission, creator fees, campaign charges, shipping and refunds. Neither is one global all-in selling rate.
TikTok’s promotional-period growth and DHL’s shopper responses do not identify an individual seller’s profit or isolate a livestream effect. Reconcile completed orders, product costs, fees, discounts, fulfillment and refunds for the actual route. Compare contribution on deduplicated orders before treating a larger audience as better economics.
Prepare consistent product ad imagery for the destination and offer you intend to measure.
Follow the native order through to retained contribution
The published US women’s dresses/tops referral rate of 6% means $6 for each $100 of the applicable fee base. That arithmetic is one charge, not a seller-profit example. Use the actual statement to apply discounts, refunds, fee reversals and other charges.
Retained contribution starts with reconciled order revenue. Deduct the garment cost, referral and creator charges, payment or logistics costs, promotion and returns costs where applicable. Then compare campaign acquisition spend with that remaining contribution. Keep the same order once when several channels claim it.
| Statement item | Contribution treatment |
|---|---|
| Collected sales and refunds | Reconcile the retained revenue for completed orders |
| Referral charge | Use the applicable category, fee base and any reversal |
| Creator and advertising charges | Include actual affiliate, campaign and media spend |
| Product and fulfillment | Deduct garment, packing, shipping and return costs |
| Result | Contribution after all included variable charges; separate fixed overhead |
FAQ
Questions about the research
Native social checkout completes the order inside a platform. Referral traffic sends a shopper to a retailer’s site, where the order completes. Discovery surveys can cover either journey without measuring checkout location. Adobe’s social-attributed holiday revenue is a retailer-site channel measure, while DHL’s buying-through-social question has a different scope.
Sources and method
- Salsify: 2026 Consumer Research
salsify.com
ReturnStudy details
October 2025 survey; January 2026 release
2,712 online shoppers in the US, UK and Canada. Self-reported behavior.
- DHL: E-Commerce Trends Report 2025
group.dhl.com
ReturnStudy details
February-March 2025
24,000 recent online shoppers across 24 markets. Survey responses.
- Eurostat: Digitalisation in Europe 2026
ec.europa.eu
ReturnStudy details
2024 category data; 2025 online activity
EU household ICT statistics. Denominators differ by indicator.
- Interactive Advertising Bureau: 2026 Outlook Study
iab.com
ReturnStudy details
January 2026; page 10
205 ad buyers in the 2026 wave. Expected changes in time or resources.
- DHL eCommerce: 2026 E-Commerce Trends Report, full research and methodology
dhl.com
ReturnStudy details
Fieldwork December 2025-February 2026
29,000 recent online shoppers in 29 countries and 5,800 businesses in 28 countries; 1,000 shoppers per country. Grocery, tickets and flights excluded. Shopper and business responses are distinct. Cited findings appear on pages 5, 30 and 42; methodology is on page 78. The try-on/fit interest measure on page 42 concerns only the app-first shopper subgroup. Self-reported adoption, reasons and preferences do not establish transaction outcomes.
- Adobe: 2025 holiday shopping results
news.adobe.com
ReturnStudy details
November-December 2025; January 2026 release
US online retail analytics covering over one trillion visits.
- TikTok Newsroom: TikTok Shop Black Friday and Cyber Monday results
newsroom.tiktok.com
ReturnStudy details
2025 US BFCM campaign versus 2024 campaign
Platform-reported seasonal results. Campaign dates and seller mix matter; livestream views are not unique buyers or incremental orders.
- Pew Research Center: Americans’ Social Media Use 2025
pewresearch.org
ReturnStudy details
February-June 2025 fieldwork
Weighted survey of 5,022 US adults. Ever-use, not purchases, advertising reach or ecommerce market share. Daily-use figures come from a separate 5,123-adult survey.
- TikTok Shop Academy US: TikTok Shop Referral Fees in 2024 by Category
seller-us.tiktok.com
ReturnStudy details
Table updated May 14, 2026; checked October 19, 2026
Public US category fee schedule, despite historical title. Listed category referral rate is not all-in selling cost. Seller-specific promotions, category differences, fulfillment, affiliate and advertising charges need separate checks. Not a global fee schedule.
- TikTok Shop Academy UK: Guidebook: Understanding Financial Statements
seller-uk.tiktok.com
ReturnStudy details
Current financial statement guide checked October 19, 2026; service fee effective July 15, 2026
UK seller settlement documentation. The 3PL Shipped-by-Seller fee has fulfillment-method conditions and exemptions. Commission, creator fees, campaign charges and logistics are separate statement lines. Not a global rate or a seller profit estimate.
- Momentum Works and Tabcut: TikTok Shop in the U.S. 2025: public research summary
thelowdown.momentum.asia
ReturnStudy details
2025 estimates, compared with 2024; February 11, 2026 release
Researcher estimates of TikTok Shop native GMV, including a US channel split and 16-market global total. The free summary does not fully disclose estimation or refund treatment. Not audited platform financial results or the entire social-commerce market.
- TikTok Newsroom: TikTok Shop Expands Across Europe: Bringing content driven shopping to Austria, Belgium, the Netherlands, and Poland
newsroom.tiktok.com
ReturnStudy details
May 28, 2026 announcement of June 15, 2026 expansion; checked October 19, 2026
Original announcement identifies Austria, Belgium, Netherlands and Poland as June 15 additions and lists six previously operating European markets. It describes in-app shopping, shoppable videos, LIVE, checkout, seller policy requirements and cross-border plans. It is an announced rollout scope, not an exhaustive October market/eligibility census or a market-specific fee schedule.
- Shopify Help Center: Setting up Facebook and Instagram by Meta
help.shopify.com
ReturnStudy details
Current integration documentation checked October 19, 2026; checkout change dated August 26, 2025
First-party documentation for Shopify’s Facebook and Instagram by Meta sales channel. It describes redirection to the merchant online store and seller tax responsibility from August 26, 2025. Instagram Shopping documentation independently confirms Shopify checkout and market/product eligibility. This is not an exhaustive worldwide Meta market list or a statement covering every non-Shopify commerce implementation.
- Pinterest Business: Pinterest Shopping: How to Sell Your Products
business.pinterest.com
ReturnStudy details
Current shopping FAQ checked October 19, 2026
Official product documentation says organic product listing is free, Pinterest does not take a sales commission, and purchases transfer to the merchant site or app rather than native Pinterest checkout. Paid campaigns are optional and separate. Merchant eligibility and paid-feature availability remain applicable. This is platform charging scope, not the full cost of operating the seller website.
- Pinterest Business Help: Create rich Pins
help.pinterest.com
ReturnStudy details
Current product documentation checked October 19, 2026
Product Pins lead to the retailer site where the item must be purchasable. Product information depends on accurate in-stock data and merchant guidelines. Catalog-created Product Pins can be promoted as shopping ads. No numerical conversion uplift or full market-availability claim is inferred.
How this report uses research
This report is an editorial synthesis by Fotogenic AI, updated on October 19, 2026. Source dates describe the underlying evidence. Survey responses, measured activity and forecasts are identified separately. Findings are not combined into a new market average. Multiple pages describing one study are treated as one evidence family.
Create with Fotogenic AI
Carry one product across social and store imagery
Use Fotogenic AI to prepare product ad scenes and variations for the exact item and offer shown at your shopping destination.