Video marketing statistics
How teams make and share video. What a product video needs to explain.
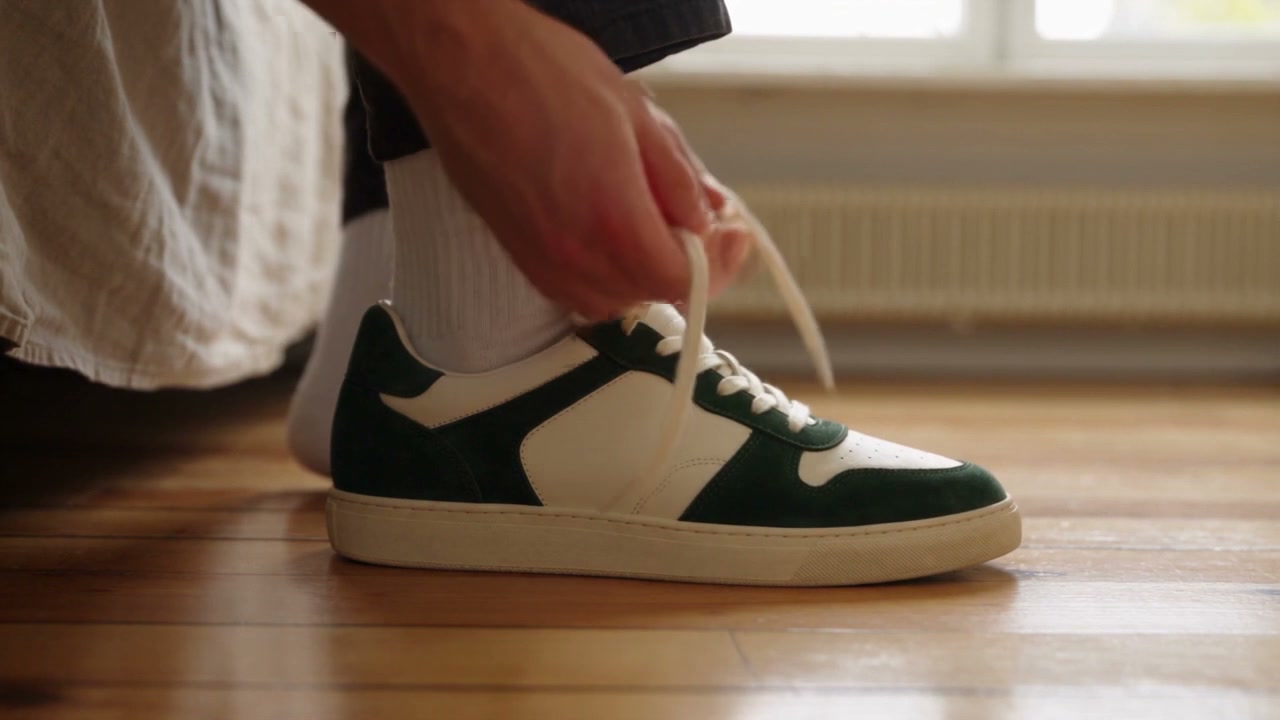
Video can explain a product, attract a click or support a purchase. This report separates viewing behavior, marketer opinion and controlled sales evidence so each result answers the right question.
Key takeaways
Choose the outcome before the format. A historical randomized apparel experiment found 14.5% higher unit sales; other video findings measure clicks, viewing or stated ROI. [6][5][3][2]
Make the opening product view count. Wistia's hosted product videos under one minute averaged a 50% share watched, rather than a 50% completion rate. [3]
Compare short-form results within the account cohort. Metricool reported 21 comments per Reel for selected Instagram accounts with 10,000-100,000 followers. [7]
Key facts at a glance
Unit-sales lift in an apparel experiment
14.5%higher apparel unit sales followed product videos in one randomized retail field experiment.
2012 experiment; one US women's apparel retailer
Anuj Kumar and Yinliang (Ricky) Tan / Management Science, INFORMSCTR advantage in a personalized-video trial
9.4 ppwas the CTR advantage of personalized AI avatar videos over personalized image ads in one randomized trial.
2025 brief; one Indian retailer, WhatsApp CTR
MIT Initiative on the Digital Economy, summarizing Kapoor and KumarAverage share watched of short product videos
50%was the average share watched for product videos under one minute.
2026 dataset; hosted product videos, not social feeds
WistiaComments per Reel for the specified account tier
21comments per Reel was the reported average for Instagram accounts with 10,000-100,000 followers.
2026 report; selected accounts with 10K-100K followers
MetricoolForecast US digital-video advertising spend
$80B+was IAB's forecast for US digital video advertising spending in 2026.
May 2026; US digital-video spending forecast
IAB, Advertiser Perceptions and GuidelineCompanies distributing video on social media
83%of surveyed companies distributed video on social media.
June 2026 survey; nearly 1,000 marketers
Wistia
Distribution and production
83% of surveyed companies distributed video on social media. [1]
Multiple channels can be used by the same company.
65% used landing pages for video distribution. [1]
The destination should match the video’s purpose.
48% distributed video through email. [1]
This does not establish direct in-email playback or a conversion lift.
38% actively used AI in video production. [1]
Active use is distinct from planned adoption.
54.3% used an in-house video or creative team. [1]
Companies could also use agencies or individual contributors.
Reported business benefits
82% of surveyed video marketers reported good ROI. [2]
Subjective assessment in a small vendor-run survey; not audited incremental profit.
83% said video directly increased sales. [2]
Reported experience does not isolate video from audience, offer or other marketing changes.
57% said video reduced support questions. [2]
A possible educational benefit to test against your own support reasons.
Observed viewing depth
52% was the average share watched for videos under one minute in Wistia’s analysis. [3]
Engagement means average percentage watched, not the percentage completing the whole video.
50% was the average share watched for product videos under one minute. [3]
Hosted-video cohort; does not predict performance on TikTok, Instagram or a particular product page.
46% was average share watched for testimonial videos under one minute. [3]
Same hosted-video analysis as the 50% product-video measure. Different tasks and audiences, not a controlled format test.
9% was average click-through for hosted videos between five and 30 minutes. [3]
A separate action metric from percent watched or completion. Length alone does not cause the click rate.
US digital video advertising outlook
$80B+ was IAB's forecast for US digital video advertising spending in 2026. [4]
A May forecast covering connected TV, online and social video, including YouTube. It is not completed spend or worldwide video-production revenue.
11% was forecast growth in total US digital video ad spending for 2026. [4]
A forward-looking annual percentage change, not an ROI estimate.
13% was forecast growth for social video advertising. [4]
Social video is already included in the total US digital-video forecast for 2026.
11% was forecast growth for connected-TV advertising. [4]
Same forecast framework. Connected TV and social video have different inventories and audience contexts; these rates do not establish merchant ROAS.
Controlled video evidence
9.4 pp was the CTR advantage of personalized AI avatar videos over personalized image ads in one randomized trial. [5]
21,328 recipients, one Indian DTC retailer and a single WhatsApp exposure. Percentage points, not percent lift; no purchase or profit effect established.
6.5 pp was the CTR advantage of personalized AI avatar videos over generic videos in the same trial. [5]
A different baseline in the same experiment. Personalization and production change together; the result cannot isolate product motion or generalize to every channel.
Controlled product-video sales evidence
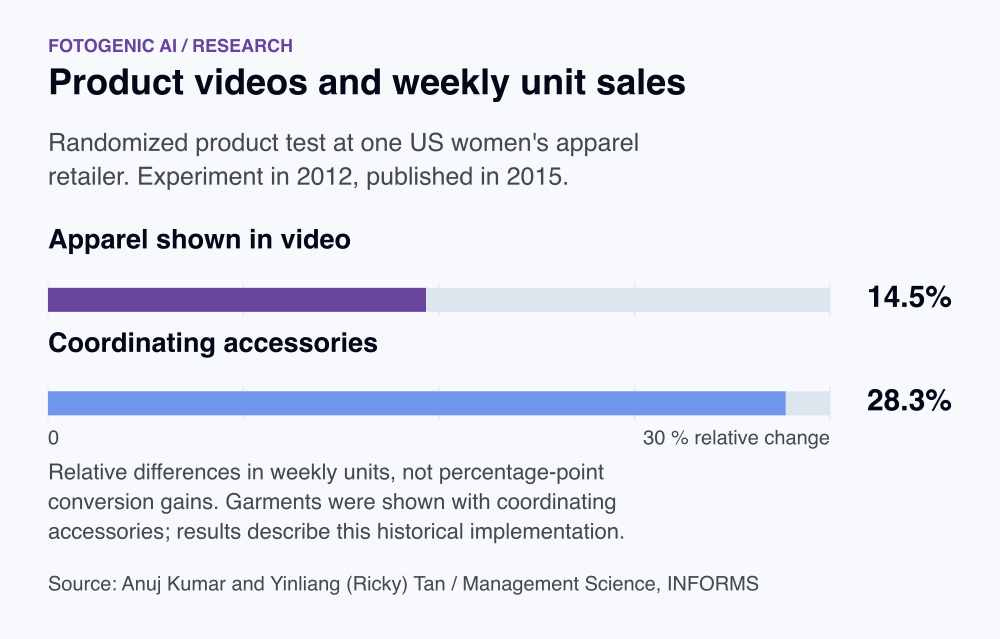
14.5% higher apparel unit sales followed product videos in one randomized retail field experiment. [6]
Historical 2012 product-randomized test at one US women's apparel retailer, published 2015. Videos showed the garment with coordinating accessories. Weekly unit-sales effect, not a 14.5-point conversion gain or a modern AI-video forecast.
28.3% higher coordinating-product unit sales were estimated in the same apparel-video experiment. [6]
Complementary accessories were shown with the focal garment, which was already pictured with them in the control. Same 2012 study, not independent corroboration. Aggregate unit sales do not identify each shopper's basket or a universal cross-sell lift.
Contemporary short-form distribution
6,177,375 videos formed Metricool's 2026 short-form comparison across Instagram, TikTok and YouTube. [7]
375,462 selected accounts; exact collection dates and complete eligibility rules are not disclosed in the public summary. Sample scale is not a performance result.
21 comments per Reel was the reported average for Instagram accounts with 10,000-100,000 followers. [7]
Account-size-specific descriptive average in the 2026 report. Different platform definitions and account composition preclude a matched-brand causal comparison or sales prediction.
Match the video format to the customer task
A social video needs to establish context quickly, while a product-page clip may need to show a specific action or detail. A distribution benchmark describes where companies place video, not which format is best for every store. Start with the question the viewer needs answered.
Define the movement and viewing angle: plan a product-photo motion brief.
Evaluate production and distribution separately
Record the cost and review effort required to produce an approved asset. Then assess how that asset performs in each placement. A clip that works in an intentional product-page play may behave differently when placed in a fast-moving social feed.
Turn an approved photo into a short sequence: explore short product-video generation.
Plan distribution before quoting a video budget
Connected TV, online video and social video are different advertising environments inside IAB's total. Forecast spending growth does not show which placement will be profitable for a product. Define the audience, purchase task, required format and paid distribution cost before commissioning the clip.
Keep production acceptance, viewing and commercial outcomes separate. A short product view can answer one question while a longer tutorial answers another. Test the approved asset on its intended placement, then review contribution rather than treating industry ad-spend growth as evidence of your campaign's ROI.
Personalization, format and placement are different choices
The WhatsApp trial compared personalized AI video with personalized images and generic video. Those baselines answer different questions. A motion-only product clip on a store page is a different intervention from an avatar addressing an existing customer. Keep purchase history, message, placement and control conditions explicit.
Test a product demonstration against the current gallery
The apparel trial added a moving model presentation to pages that already showed garments and matching accessories in still photographs. The effect includes motion and outfit presentation together. For a current store, compare eligible products using a stable gallery, then measure completed orders and returns over the same window.
Choose a short-form placement by its job
Metricool's 2026 comparison reports that results vary with account size: its medium-account Reels example emphasizes conversation, while TikTok's public summary emphasizes views. These are selected-account distribution patterns, not proof of where an apparel brand will sell more.
Use the same campaign question across placements, then adapt framing and on-screen information to the actual feed. Compare your account's qualified destination visits and orders over a fixed window; keep those outcomes separate from platform views and hosted-video share watched.
| Product-motion brief | Requirement | Verification |
|---|---|---|
| Question and source | Show garment texture, silhouette or a useful styling detail from the source item | Does every frame preserve the product and included items? |
| Placement and framing | Specify feed, page or email destination and its safe visible area | Preview on the intended phone placement |
| Information and access | Use readable on-screen text and captions when speech carries information | Can the point be understood without sound? |
| Outcome | State the product-page action and order/return follow-up | Track qualified visits, contribution and any misleading-detail complaints |
FAQ
Questions about the research
Choose the length needed to answer the product question. In Wistia’s hosted-video analysis, product videos under one minute averaged 50% of their duration watched. Videos between five and 30 minutes averaged 9% click-through for a different, often deeper task. Neither result proves a universal ideal length or a completion or sales rate.
Sources and method
- Wistia: Video strategy research for 2026
wistia.com
ReturnStudy details
June 2026
Survey of nearly 1,000 marketers. Not a retail-only sample.
- Wyzowl: Video Marketing Statistics 2026
wyzowl.com
ReturnStudy details
Late 2025 survey; 2026 edition
266 unique respondents across marketers and consumers. Questions target separate respondent groups. Small vendor-run survey, not a representative census or a controlled return-on-investment experiment.
- Wistia: Video length and engagement
wistia.com
ReturnStudy details
Page references the 2026 State of Video dataset
Platform analysis of over 13 million videos. Engagement is average share watched, not completion rate or sales conversion. Website-hosted video audience differs from social feeds.
- IAB, Advertiser Perceptions and Guideline: 2026 Digital Video Ad Spend and Strategy, Part One
iab.com
ReturnStudy details
May 5, 2026 forecast
US digital video includes connected TV, online video and social video including YouTube. Spending growth is a forecast, not completed annual revenue. The release does not provide the buyer-survey sample size or field dates. Campaign agentic-AI stages are separate from creative video-generation adoption.
- MIT Initiative on the Digital Economy, summarizing Kapoor and Kumar: Can Generative AI Create Low-Cost Personalized Video Ads That Engage Consumers?
ide.mit.edu
ReturnStudy details
2025 research brief; paper published May 8, 2025; exact experiment dates not disclosed in brief
Randomized single-exposure WhatsApp field experiment with 21,328 recipients of one Indian DTC retailer. Personalized avatar videos used purchase histories; baselines were personalized images and generic videos. CTR is engagement, not sales or profit. Production-cost estimates are back-of-envelope and excluded here.
- Anuj Kumar and Yinliang (Ricky) Tan / Management Science, INFORMS: The Demand Effects of Joint Product Advertising in Online Videos
pubsonline.informs.org
ReturnStudy details
2012 experiment; published online March 26, 2015; August 2015 journal issue
One US women's apparel retailer. Product-randomized addition of videos showing garments with coordinating accessories over 28 weeks. 66 of 319 principal products assigned video; focal-product analysis excludes cross-exposed products, leaving 58 treated and 239 controls. Difference-in-differences with pre-video, video-on and video-off periods. Outcomes are weekly product unit sales, not visitor conversion, modern AI video or a representative merchant average.
- Metricool: The State of Short-Form Social Media in 2026
metricool.com
ReturnStudy details
August 26, 2026 publication; exact collection dates not disclosed in public summary
Vendor analysis of 6,177,375 videos from 375,462 accounts across Instagram, TikTok and YouTube, as specified on the linked report landing page. Selected connected accounts, not all merchants. Public summaries do not disclose exact collection dates or complete eligibility rules. Account-size findings are descriptive; cross-platform definitions and account mix can differ. Not a matched-brand causal comparison or sales outcome.
How this report uses research
This report is an editorial synthesis by Fotogenic AI, updated on October 19, 2026. Source dates describe the underlying evidence. Survey responses, measured activity and forecasts are identified separately. Findings are not combined into a new market average. Multiple pages describing one study are treated as one evidence family.
Create with Fotogenic AI
Create a short product clip from your image
Use Fotogenic AI to generate a short product video from a product image. Define the garment detail, movement and placement before reviewing the clip.