User-generated content statistics
Why shoppers seek customer photos. How to make real experiences useful.
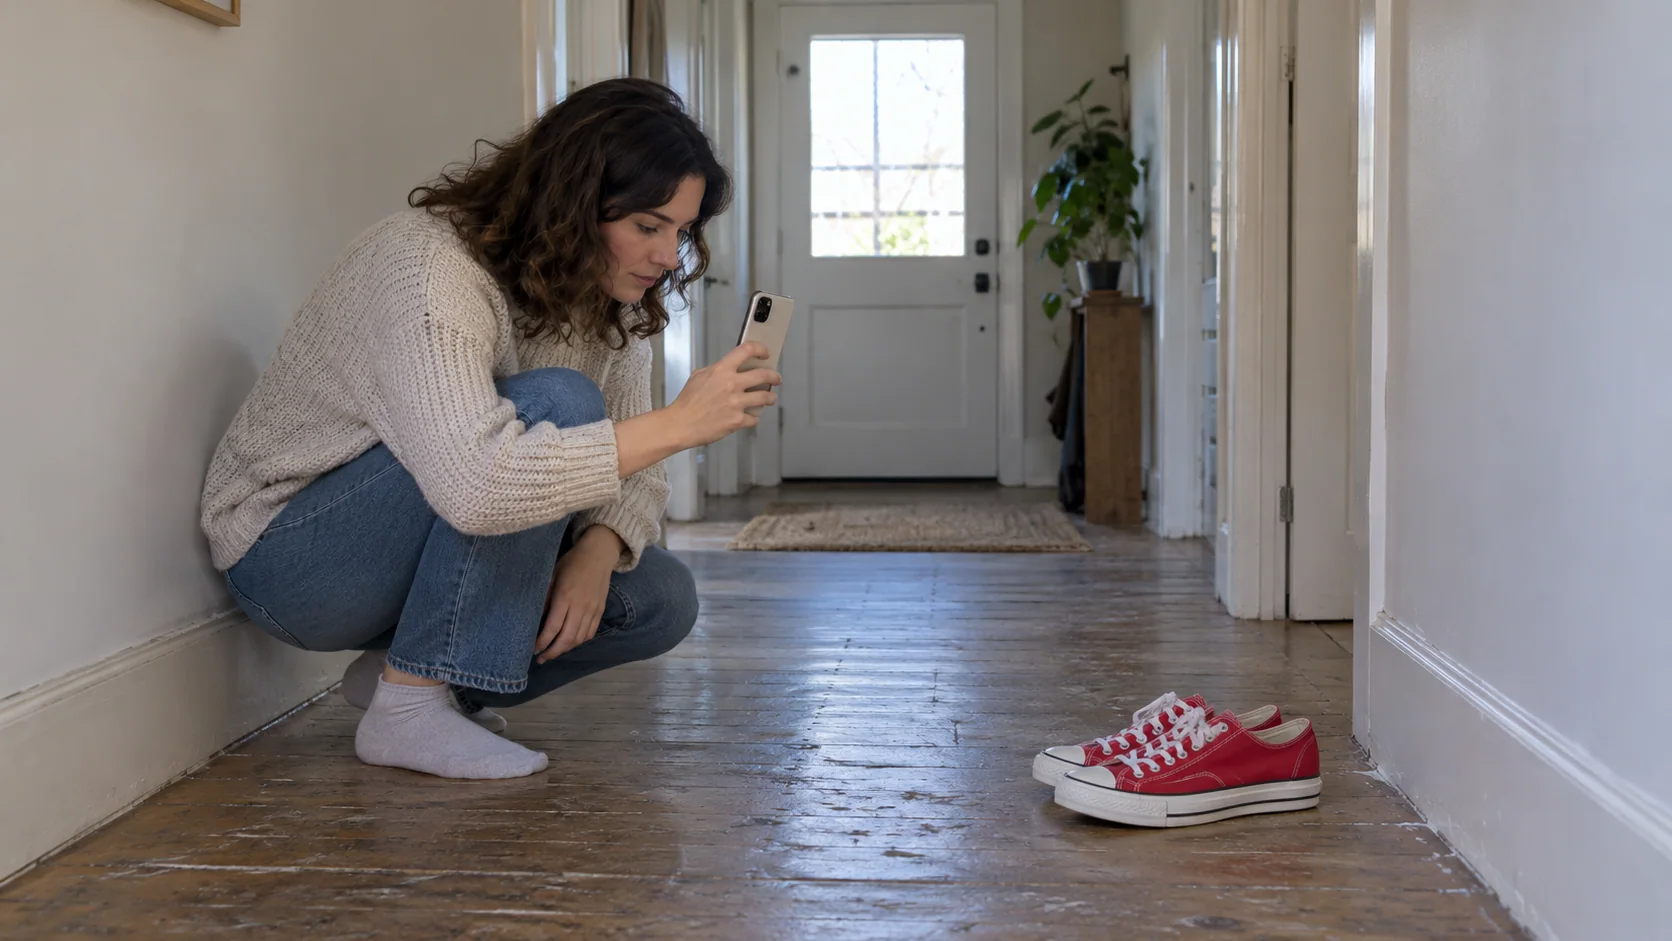
Customer photos and videos can answer questions about use, quality and size that brand campaigns leave open. Shopper preferences and observed gallery-interaction results are useful evidence, with different limits.
Key takeaways
Put useful customer evidence beside the item. In the dated US survey, 84% wanted customer photos and videos directly on product pages. [5]
Select submissions that explain the garment. In the same survey, 88% considered customer visuals helpful for clothing purchases, with a sample skewed toward women and millennials. [6]
Commissioned creator clips need their own budget and context. Starting supplier prices describe paid production, rather than unsolicited customer reviews or a full campaign. [8][9]
Key facts at a glance
Shoppers wanting customer visuals on product pages
84%wanted customer photos and videos directly on product pages.
Dec 2023; US survey, 88% women, stated preference
PowerReviewsShoppers finding clothing visuals useful
88%considered customer visuals helpful when buying clothing.
Dec 2023; same skewed US sample, stated usefulness
PowerReviewsConversion association with gallery interaction
110.7%higher conversion was associated with review-image gallery interaction.
1.5M-page analysis; self-selected users, association
PowerReviewsShoppers using visuals to understand real-life use
89%valued customer visuals for seeing a product in real life.
Dec 2023; 15,870 US consumers, skewed sample
PowerReviewsShoppers using visuals to judge quality
70%valued them for understanding quality or performance.
Dec 2023; 15,870 US consumers, skewed sample
PowerReviewsShoppers perceiving customer visuals as authentic
68%considered them more authentic than brand-created imagery.
Dec 2023; 15,870 US consumers, skewed sample
PowerReviews
Why customer visuals help
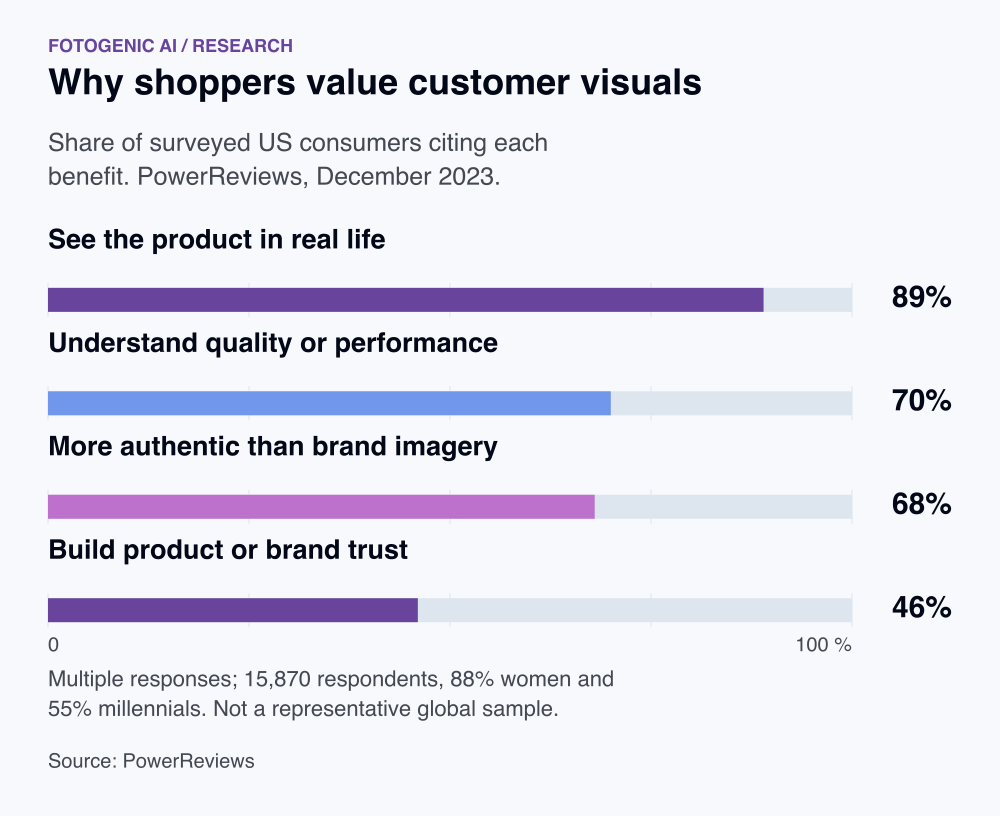
89% valued customer visuals for seeing a product in real life. [1]
Respondents could choose multiple reasons.
70% valued them for understanding quality or performance. [1]
Stated value does not guarantee that every submission is useful.
68% considered them more authentic than brand-created imagery. [1]
The perception relates to real customer content.
46% said customer visuals build product or brand trust. [1]
The survey is historical and skewed toward women and millennials.
61% said visual reviews made them much more likely to buy. [2]
This is a likelihood response, not observed incremental conversion.
Research depth and gallery behavior
60% consulted two or three sources before feeling confident enough to buy. [3]
Self-reported research behavior; sources can include more than reviews.
37% consulted at least four sources before buying. [3]
A separate research-depth category in the same survey.
97% consulted multiple sources before purchase. [3]
Does not mean 97% read visual reviews; the public release omits sampling details.
110.7% higher conversion was associated with review-image gallery interaction. [4]
Observed association, not proof that UGC caused that uplift; more interested shoppers may choose to interact.
Where customer visuals are useful
84% wanted customer photos and videos directly on product pages. [5]
December 2023 US survey; stated placement preference. Same study family as the other visual-content preferences, not independent corroboration.
54% wanted customer visuals on product-category or search pages. [5]
Multiple placements could be selected. This is not a measured improvement in category click-through.
88% considered customer visuals helpful when buying clothing. [6]
The US survey was 88% women and 55% millennials. This is category-specific stated usefulness, not the percentage of apparel shoppers who convert.
Current shopper trust and product evidence
83% said they trusted a customer photo over a professional studio shot in holiday research. [7]
March 2026 North American survey. Preference wording is publisher-reported; this does not make every customer image accurate or establish conversion lift.
Commissioned creator-video pricing
$89 was soona's advertised starting price per commissioned UGC video. [8]
Supplier-specific USD starting offer checked October 19, 2026. A basic creator commission is different from an unsolicited customer submission or a full campaign budget.
$99 was Billo's advertised starting price per basic creator video. [9]
October 2026 offer including creator pay, platform access and transaction fees. Product, shipping and optional additions are separate; orders use prepaid balance packs.
Preserve the customer, product and context
Keep genuine customer evidence associated with the original submission and exact product or variant. Choose media that explains scale, texture, fit, assembly or use. Avoid crops that remove details needed to understand the experience.
A generated scene, brand script or paid endorsement must not become an unsolicited customer experience through its caption or placement. Use brand-created imagery for the job it actually performs, and preserve truthful context for customer and creator submissions.
Complement genuine customer photos: plan complementary product photography.
Collect, clear and record each reuse
Use a permission workflow before moving a customer submission into another placement. PowerReviews' historical collection guide describes requesting permission and matching media to products. The operating record below also makes later changes easier to review.
| Collection record | Required detail | Reuse decision |
|---|---|---|
| Product match | Exact garment variant and the customer's original photo/video and account | Use only where the submission describes the pictured item |
| Experience and context | Customer's own fit/use account; any gift, payment or incentive | Preserve material context and relevant disclosure |
| Permission | Agreed store, social or paid placements, edits and duration | Approve only the permitted placement and crop |
| Asset continuity | Original file linked to the permitted edited version | Retain product details and handle later scope changes |
Preserve the exact product in brand-created scenes: understand brand-created lifestyle imagery.
Check placement and disclosure separately
Match product-page media to the exact item and keep specifications easy to inspect. Category-page media should help a shopper choose which item to investigate. Use the dated shopper preferences as a prompt to find missing information, rather than a target for gallery volume.
Permission to reuse an asset and disclosure of a material connection answer different questions. For US-facing endorsements, payment or a free product can require a clear disclosure with the endorsement. Preserve that context when permitted media moves into a new placement; a permission record does not replace it.
Keep brand-created lifestyle product photography separate from genuine customer submissions.
Budget production and reuse separately
A commissioned creator clip buys a defined production service. Compare format, revisions, delivery, licensing and paid distribution before treating two starting prices as equivalent. Include the product and shipping where required, and distinguish the minimum asset price from the amount paid into a prepaid account.
Measure the content question before claiming an effect
Review-image interaction can signal shopper interest as well as help a decision. The observed association on this page cannot establish the orders caused by adding a gallery. If testing customer photos, assign the eligible product-page audience consistently and compare completed orders and reason-coded returns over the same window.
Keep the test content tied to the exact product and permitted use. A sponsored demonstration or generated scene cannot stand in for evidence that a customer bought, wore or reviewed the garment.
FAQ
Questions about the research
In PowerReviews’ historical survey, 89% valued customer visuals for seeing the product in real life and 70% for judging quality or performance. Curate genuine submissions by the information missing from the product page, such as scale, fit or use. Keep customer evidence distinct from paid creator content and brand-generated scenes.
Sources and method
- PowerReviews: Why shoppers value customer visuals
powerreviews.com
ReturnStudy details
December 2023; 2024 report
15,870 US consumers. Multiple-choice survey; 88% women, 55% millennials.
- PowerReviews: Customer visuals and purchase likelihood
powerreviews.com
ReturnStudy details
December 2023; 2024 report
15,870 US consumers. Stated likelihood, not a randomized conversion test.
- Bazaarvoice: Shopper Experience Index 2026: research before purchase
bazaarvoice.com
ReturnStudy details
June 23, 2026 release
Self-reported shopper behavior. The public release does not supply sample size, fieldwork dates or country mix, limiting generalization. Discovery archetypes are not measured sales attribution.
- PowerReviews: Image and video interaction analysis
powerreviews.com
ReturnStudy details
Public analysis checked October 18, 2026; observation year unspecified
Aggregated interaction analysis covering 1.5 million product pages. Self-selected gallery users can differ from non-users. Relative conversion association is not causal uplift from adding imagery.
- PowerReviews: Where shoppers want customer photos and videos
powerreviews.com
ReturnStudy details
December 2023; 2024 report
15,870 US consumers; 88% women and 55% millennials. Multiple-response preference survey, not representative category conversion or causal lift. Same study as the other PowerReviews visual-content survey pages.
- PowerReviews: Product categories where customer visuals are helpful
powerreviews.com
ReturnStudy details
December 2023; 2024 report
15,870 US consumers; 88% women and 55% millennials. Multiple-response preference survey, not representative category conversion or causal lift. Same study as the other PowerReviews visual-content survey pages.
- Bazaarvoice: Why authentic holiday content is key to your holiday marketing strategy
bazaarvoice.com
ReturnStudy details
March 2026 survey; April 14, 2026 publication
1,246 North American shoppers aged 18+. Stated holiday trust and purchase preferences. Public article gives no weighting, country split or questionnaire. Does not estimate actual conversion or all generated product photography.
- soona: Product photography and video pricing
soona.co
ReturnStudy details
Published price list checked October 19, 2026
Supplier-specific USD list prices, not a representative industry average. Studio Pass, ordered assets, models, styling, upgrades and premium editing have distinct charges. Advertised delivery is asset editing delivery, not sample-to-launch time.
- Billo: How Billo pricing works: what you pay for UGC videos
billo.app
ReturnStudy details
October 9, 2026 price explanation; checked October 19, 2026
Supplier-specific USD starting price for a basic commissioned creator video. Creator compensation, platform access and transaction fees are included; product, shipping and optional additions are separate. Prepaid balance packs are required. Not an industry average, a creator take-home quote or unsolicited customer content.
- US Federal Trade Commission staff: Disclosures 101 for Social Media Influencers
ftc.gov
ReturnStudy details
November 2019 staff brochure, checked October 19, 2026
Official US endorsement-disclosure guidance, not statistical research or an exhaustive statement of other countries’ laws. Material connections can include payment, gifts and personal or employment relationships. The current FTC endorsement FAQ supplies further context.
How this report uses research
This report is an editorial synthesis by Fotogenic AI, updated on October 19, 2026. Source dates describe the underlying evidence. Survey responses, measured activity and forecasts are identified separately. Findings are not combined into a new market average. Multiple pages describing one study are treated as one evidence family.
Create with Fotogenic AI
Add brand scenes alongside customer evidence
Use Fotogenic AI to create product and lifestyle imagery for your store. Keep customer photos, reviews and commissioned endorsements connected to their actual source and context.