Ecommerce content marketing statistics
What useful content needs to do. How teams connect it to real outcomes.

Ecommerce content should answer a buying question and give the shopper a useful next step. This report combines product-research behavior, search discovery and a named apparel content workflow, with B2B evidence kept separate.
Key takeaways
Keep product information consistent across discovery channels. In Salsify's survey, 54% of shoppers used two or three channels to research mid-range items. [6]
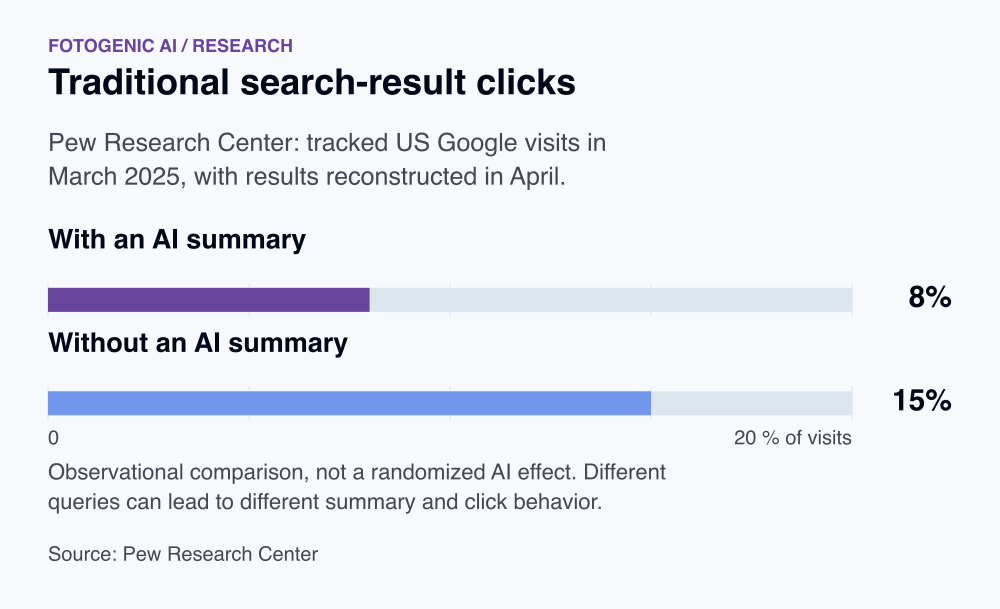
Answer the buying question on the page itself. Pew observed fewer traditional-result clicks on Google visits with AI summaries, using US browsing data from March 2025. [7]
Let customer context shape the brief. Criquet Shirts reported gift purchases rising from 20% for most of the year to 45% around Father's Day in its merchant case. [8]
Key facts at a glance
Shoppers researching across two or three channels
54%of Salsify-surveyed shoppers used two or three channels to research mid-range items.
Oct 2025; 2,712 shoppers in three markets
SalsifyGoogle visits with AI summaries producing clicks
8%of Google visits with an AI summary led to a traditional search-result click in Pew's analysis.
March 2025 browsing; 900 consenting US adults
Pew Research CenterSales lift from AI-assisted descriptions
2.05%relative sales lift followed AI-assisted product descriptions in one randomized study.
2025 preprint; one retail platform, relative sales
Cui and coauthors / arXivGift orders in a named apparel case
20%of customers said an order was a gift for most of the year in Criquet Shirts' reported post-purchase survey.
Oct 2026 case; named merchant, sample undisclosed
Klaviyo, interviewing Criquet ShirtsMarketers facing personalized-content demand
78%of marketers needed more personalized content than they could produce.
Oct-Nov 2025; 4,450 marketing decision makers
SalesforceB2B marketers with a content strategy
97%of surveyed B2B marketers had a content strategy.
2026 report; B2B marketers, not ecommerce-only
Content Marketing Institute
Strategy and measurement challenges
97% of surveyed B2B marketers had a content strategy. [1]
Having a strategy does not establish its quality.
40% identified prompting a desired action as a top challenge. [1]
The question allowed three challenge selections.
33% identified measuring effectiveness as a top challenge. [1]
Measurement needs to be designed before publication.
63% used leads or pipeline influence to assess thought leadership. [1]
Business impact is different from reach.
78% of marketers needed more personalized content than they could produce. [2]
This separate cross-industry survey measures reported capacity pressure.
Formats and observed outcomes
68% of surveyed video marketers created explainer videos. [3]
Content format usage, not the share of all B2B marketers or a conversion benchmark.
39% created product demonstration videos. [3]
Multiple formats can be used by one respondent; shares are not exclusive.
32% used bottom-line sales to assess video ROI. [3]
The definition of success varies across respondents, so reported ROI is not directly comparable.
2.05% relative sales lift followed AI-assisted product descriptions in one randomized study. [4]
One platform, preprint, human description retained beneath additional AI text. This is not evidence for every content format or image.
79M viewing hours informed Wistia’s 2026 video research. [5]
Observed hosted-video dataset, separate from the professional survey. Dataset scale does not establish an ecommerce content ROI.
Search discovery and cross-channel product research
54% of Salsify-surveyed shoppers used two or three channels to research mid-range items. [6]
October 2025 self-reported research behavior across the US, UK and Canada. Channels are not page visits or measured conversion steps.
8% of Google visits with an AI summary led to a traditional search-result click in Pew's analysis. [7]
March 2025 tracked browsing with results reconstructed in April. Observational, not retail-only; query differences can affect both summary presence and clicking.
15% of visits without an AI summary led to a search-result click in the same analysis. [7]
Same US panel and historical window. The difference from summary-bearing visits is not a randomized estimate of traffic lost to AI.
1% of visits with an AI summary led to a click on a link inside the summary. [7]
Next-recorded-URL measure. Summary links were reconstructed later, and links appearing in both locations were counted toward the summary.
Named apparel content and audience context
20% of customers said an order was a gift for most of the year in Criquet Shirts' reported post-purchase survey. [8]
Named apparel merchant account published October 2026. Survey sample size and field dates are not disclosed; the merchant reports the share reached 45% around Father's Day. Not a market-wide gifting benchmark.
Map a format to a buying question
Choose the question first, then the format and placement. This planning map pairs concrete ecommerce content with an observable next action. The suggested events are measurement choices, not promised sales effects.
| Buying question | Content to prepare | Distribution and measurement |
|---|---|---|
| How does the garment sit? | Front, back and detail views alongside factual size guidance | Product page; gallery use, purchases and reason-coded returns |
| How can I style the item? | A coordinated scene that identifies what is sold separately | Collection page, editorial guide and linked email; qualified product visits |
| Is this a gift? | Clear product details, delivery cutoff and gift/return information | Gifting page and permissioned seasonal message; contribution by acquisition cohort |
Connect a buyer question to an instructional asset: create WordPress page images.
Separate content use from an order outcome
Define how each success event is observed before launch. A video play, a completed tutorial step and a paid order answer different questions. If a step cannot be observed, choose a measurable action rather than reporting every page view as completion.
Follow the next relevant product action and qualifying orders separately. Keep the event definition and attribution window stable across a comparison. B2B marketer surveys, hosted-video analytics and retail experiments describe different populations; none supplies a universal revenue value per content visit.
Make the visual instructions specific: write a clear visual brief.
Give each distribution route a useful destination
Pew's historical search study and Salsify's shopper survey describe different parts of discovery. They support inspecting the path from a question to a useful destination, rather than predicting traffic for an individual article.
Keep one clear answer on the destination page, with the product context, required inputs and dated evidence a reader needs. Adapt an excerpt for its channel and link to the section that resolves the question. Check whether visitors reach that answer and the next relevant product or workflow action.
The Fotogenic AI web app page explains the visual creation surface for assets supporting your content.
Use customer context to choose what to publish
Criquet Shirts describes adding a gift question to its post-purchase survey and changing messaging around gifting seasons. This is a concrete apparel content decision based on customer context, rather than a prescription to send everyone more content. The vendor account does not supply an independent causal test of that tactic.
Choose one buying question, the page that answers it and the distribution route that reaches the relevant audience. Reuse the product reference across those placements, then evaluate qualified visits, orders and returns within a stated window. Content-assisted revenue is attribution, so use a comparison group when asking whether the content created additional demand.
FAQ
Questions about the research
Connect the article’s buying question to a relevant next task, such as inspecting garment measurements, planning a product gallery or starting a visual-production workflow. Track qualified visits, those actions and later customer contribution separately. B2B pipeline surveys supply operating context, while the retail product-description experiment tests one specific content treatment.
Sources and method
- Content Marketing Institute: B2B content and marketing trends for 2026
contentmarketinginstitute.com
ReturnStudy details
2026 report
B2B marketer survey. Not an ecommerce-only sample or a causal study.
- Salesforce: State of Marketing 2026
salesforce.com
ReturnStudy details
October 8-November 17, 2025 survey; February 19, 2026 release
Double-anonymous survey of 4,450 marketing decision makers across North America, Latin America, Asia-Pacific and Europe. Marketer perceptions, not consumer behavior or an ecommerce-only census. Performance categories describe satisfaction with marketing outcomes.
- Wyzowl: Video Marketing Statistics 2026
wyzowl.com
ReturnStudy details
Late 2025 survey; 2026 edition
266 unique respondents across marketers and consumers. Questions target separate respondent groups. Small vendor-run survey, not a representative census or a controlled return-on-investment experiment.
- Cui and coauthors / arXiv: Generative AI and Firm Productivity: Field Experiments in Online Retail
arxiv.org
ReturnStudy details
October 2025 working paper, version 1
Randomized workflows at one cross-border platform. Effects are relative to workflow-specific controls. The study is a preprint and does not test product-image generation. Support control offered no presale assistance; message sales effect was not statistically significant.
- Wistia: 2026 State of Video statistics
wistia.com
ReturnStudy details
April 2026 report
900+ surveyed professionals plus over 13 million hosted videos and 79 million viewing hours. Survey and observed-video datasets have different denominators; not retail-only.
- Salsify: 2026 Consumer Research
salsify.com
ReturnStudy details
October 2025 survey; January 2026 release
2,712 online shoppers in the US, UK and Canada. Self-reported behavior.
- Pew Research Center: Google search clicks with and without AI summaries
pewresearch.org
ReturnStudy details
March 2025 browsing; April 7-17 result collection; July 22 publication
900 consenting US adults in KnowledgePanel Digital; 68,879 unique Google searches. Browsing was tracked in March and results reconstructed in April, so results could have changed. Observational, not randomized or retail-only. Clicks follow the next recorded URL; a link in both places counts toward the AI summary.
- Klaviyo, interviewing Criquet Shirts: How Criquet Shirts used AI segmentation to send fewer emails and earn more
klaviyo.com
ReturnStudy details
October 14, 2026 publication; precise case observation dates not disclosed
Named apparel-merchant account reported by its marketing-platform vendor. Post-purchase gifting survey and message-segmentation operating details are used here. No sample counts, randomization protocol or independently audited revenue is supplied; vendor-reported growth is not adopted as a causal content or retention benchmark.
How this report uses research
This report is an editorial synthesis by Fotogenic AI, updated on October 19, 2026. Source dates describe the underlying evidence. Survey responses, measured activity and forecasts are identified separately. Findings are not combined into a new market average. Multiple pages describing one study are treated as one evidence family.
Create with Fotogenic AI
Turn a buying question into a visual brief
Use Fotogenic AI to create product scenes for an apparel guide, collection page or campaign. Start with the garment and the information the shopper needs to see.