Ecommerce conversion and imagery statistics
What imagery research can tell you. How to test its effect on sales.
Conversion benchmarks vary by category, device and traffic source. The available imagery evidence includes shopper opinion, gallery-interaction associations and controlled click engagement, which answer different questions.
Key takeaways
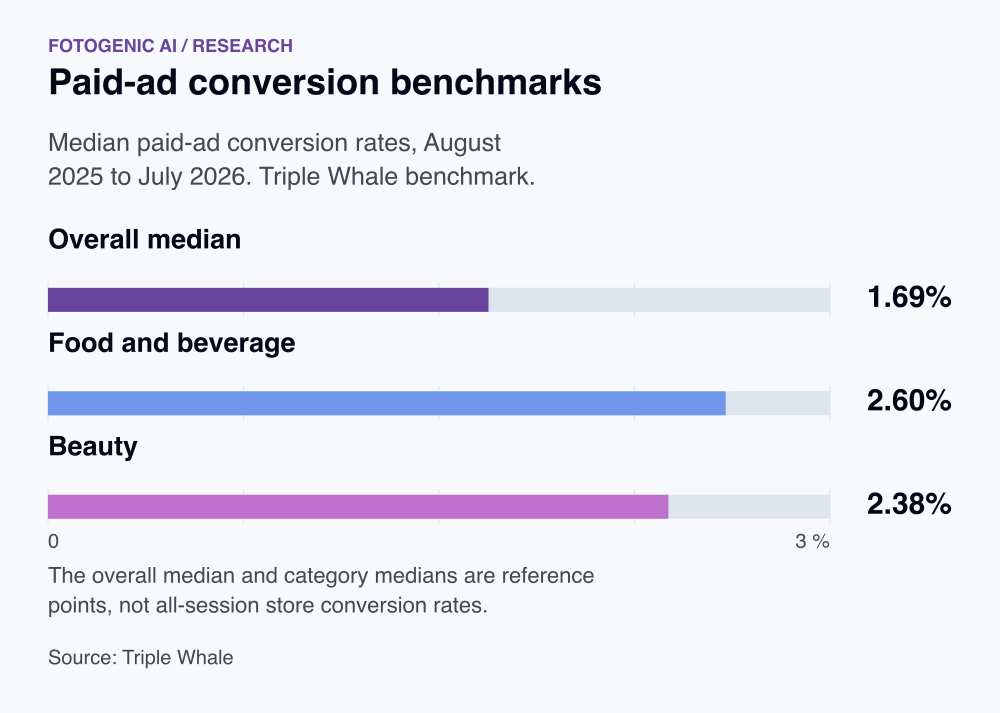
Start with a relevant benchmark: the median paid-ad conversion rate was 1.69%, while category and device figures used different visitor populations. [1][2]
Customer visuals can inform a gallery test. Higher conversion among review-gallery users is an association, rather than proof of the orders a new gallery will create. [3][4]
Measure the buying outcome you need. Pinterest background generation improved ad engagement, whereas the Rakuten case tested page performance with appearance held constant. [5][6]
Key facts at a glance
Median paid-ad conversion
1.69%was the median paid-ad conversion rate in the benchmark.
Paid-ad median, August 2025-July 2026
Triple WhaleDesktop retail conversion
3.7%was the desktop retail conversion rate in Contentsquare’s summary.
Contentsquare 2026 retail summary
ContentsquareGallery-interaction conversion association
110.7%higher conversion was associated with interaction with review image galleries.
Year unspecified; observed association, not lift
PowerReviewsFood and beverage paid conversion
2.60%was the food and beverage paid-ad conversion benchmark.
Food/beverage paid-ad median, 2025-2026
Triple WhaleBeauty paid conversion
2.38%was the beauty paid-ad conversion benchmark.
Beauty paid-ad median, 2025-2026
Triple WhaleVisual reviews and purchase intention
91%said visual reviews made them more likely to purchase.
Dec 2023 shopper intention, not measured lift
PowerReviews
Conversion benchmarks
1.69% was the median paid-ad conversion rate in the benchmark. [1]
This August 2025-July 2026 figure is a paid-traffic benchmark, not a target for every store.
2.60% was the food and beverage paid-ad conversion benchmark. [1]
Product category and purchase frequency change what a useful comparison looks like.
2.38% was the beauty paid-ad conversion benchmark. [1]
Compare equivalent traffic, markets and attribution before diagnosing a gap.
3.7% was the desktop retail conversion rate in Contentsquare’s summary. [2]
A retail-site benchmark with a different population and denominator from paid-ad conversions.
1.4% was the desktop luxury conversion rate. [2]
A luxury-category comparison; the retail aggregate represents a different store mix.
0.9% was the mobile luxury conversion rate. [2]
Observed device differences do not prove that device choice caused the difference.
Visual evidence and customer confidence
91% said visual reviews made them more likely to purchase. [3]
The 2024 report measures stated preference. It does not establish a 91% conversion uplift.
23% said they would not buy without customer photos or videos. [3]
This sample was not demographically representative of every store audience.
110.7% higher conversion was associated with interaction with review image galleries. [4]
Relative observational association from PowerReviews, not a randomized effect of adding a gallery. Intent and visitor selection can explain part of the difference.
7.6% relative lift in the rate of clicks lasting at least 30 seconds followed Pinterest background outpainting. [5]
Platform A/B engagement measure, not completed orders. The corresponding CTR lift was 18.0%; different funnel stages need separate outcomes.
Delivery performance and commercial outcomes
53.37% relative revenue-per-visitor improvement was reported in Rakuten 24's performance A/B test. [6]
Historical single-page case, with a one-month 50/50 split and unchanged appearance/functionality. Performance changes included images and scripts; no effect can be assigned to new creative photography alone.
AR and 3D implementation outcomes
67% higher mobile conversion was reported in Goodr’s combined AR try-on and 3D-viewer case. [7]
Historical vendor-reported combined implementation. Public comparison construction is undisclosed, so the effect cannot be assigned to try-on alone.
Choose the right conversion denominator
A conversion rate is only interpretable when its numerator and denominator are explicit. Purchases divided by sessions is different from purchasers divided by users, and both differ from a platform rate based on ad clicks. The paid-traffic medians here cannot be treated as targets for every visit to an online store.
Build the gallery treatment: follow the WooCommerce product-image workflow.
Specify a garment-gallery test before producing it
Test a purchase question: does adding a fabric-detail and construction view help eligible shoppers choose the garment? Assign visitors consistently to the existing gallery or the revised gallery. Keep the selected variant, price, promotion, delivery terms and image-delivery settings fixed.
| Decision | Test specification |
|---|---|
| Eligible audience | Product-page visitors with the tested garment and variant available; exclude staff and test orders |
| Treatment | Add the defined detail views; preserve the existing primary view and other page content |
| Primary outcome | Qualifying purchases divided by all assigned eligible visitors, including people who never open the gallery |
| Order economics | Net revenue and contribution per assigned visitor, after refunds and variable order costs |
| Returns follow-up | Wait for the stated return window; compare fit, color and item-mismatch reasons separately |
Keep the test focused: plan controlled composition and lighting variations.
Diagnose image delivery before changing the creative
A shopper cannot inspect an image that arrives late or loads without enough detail. First check responsive image sizes, the initial product view and zoom. Then test creative changes separately. Rakuten's performance experiment held appearance and functionality constant, making it evidence about delivery rather than a new photographic style.
For an image-delivery test, keep product content fixed and record successful image loads, conversion and contribution for the same eligible visitors. For a creative test, keep delivery settings fixed. Separating the interventions makes the result easier to interpret.
Prepare a controlled treatment with image variations while keeping the product reference fixed.
Does a richer gallery always improve conversion?
A 2019 randomized fashion-retailer study found that alternative product photos increased purchase likelihood, whereas zoom on its own reduced it. The combination also differed from the individual treatments. The experiment covered 22,051 visitors and 15,942 products; it does not identify one image count for every product.
Treat useful information and interface effort as separate variables. A closeup can reveal construction; another nearly identical angle may add little. Compare eligible visitors with the same product, offer and delivery settings.
Distinguish product-video sales effects from engagement
The historical apparel-video experiment measured weekly product units sold after videos were assigned to selected products. That outcome differs from ad clicks or the behavior of shoppers who voluntarily open a gallery. Its coordinated outfit presentation also limits what it can tell a store about a standalone product clip.
What do imagery studies establish about order value and returns?
Historical randomized fit-information research found higher order value and lower return-related fulfillment costs. That intervention supplied size recommendations. The accessible abstract gives no numerical effect size, and it does not establish an AOV or returns gain from adding generated product photos. Track those outcomes in the gallery test rather than importing the fit-tool result.
FAQ
Questions about the research
Triple Whale reported a 1.69% median paid-ad conversion rate for August 2025-July 2026, with food and beverage at 2.60% and health and beauty at 2.38%. These are paid-traffic platform cohorts, not targets for every store visit. Compare the same category, traffic source and purchase denominator before evaluating a gallery change.
Sources and method
- Triple Whale: Ecommerce benchmarks 2026
triplewhale.com
ReturnStudy details
August 2025-July 2026
Triple Whale paid-ad benchmarks covering 53,000+ brands. Not all-session store conversion rates.
- Contentsquare: 2026 retail conversion benchmarks
contentsquare.com
ReturnStudy details
Updated February 12, 2026
Retail subset of the 2026 Digital Experience Benchmarks. This public summary does not disclose the eligible retail sample or exact comparison window. Device and category results must stay separate.
- PowerReviews: Customer visuals and purchase likelihood
powerreviews.com
ReturnStudy details
December 2023; 2024 report
15,870 US consumers. Stated likelihood, not a randomized conversion test.
- PowerReviews: Image and video interaction analysis
powerreviews.com
ReturnStudy details
Public analysis checked October 18, 2026; observation year unspecified
Aggregated interaction analysis covering 1.5 million product pages. Self-selected gallery users can differ from non-users. Relative conversion association is not causal uplift from adding imagery.
- Pinterest Research: Pinterest Canvas: Large-Scale Image Generation at Pinterest
arxiv.org
ReturnStudy details
June 2026 revision; KDD 2026 accepted paper
Platform-authored research. Table 2 reports relative online A/B engagement changes for background and aspect-ratio outpainting against different original-image controls. Table 1 reports human quality checks on 996 products, two trained raters per output. No merchant sales, profit or return outcome is established. Model versions and tasks are specific to this evaluation.
- Rakuten 24 and Google web.dev: Rakuten 24 performance A/B case
web.dev
ReturnStudy details
August 2022 case publication
Japanese daily-necessities retailer. One landing page, one-month 50/50 A/B test of performance optimizations, with no functional or visual differences. Public case does not disclose test dates, sample size or confidence intervals. Multiple delivery changes, not an image-creative experiment.
- Snap Inc.: Introducing AR Enterprise Services: historical merchant results
newsroom.snap.com
ReturnStudy details
Goodr internal data March 15-August 15, 2022; March 23, 2023 publication
Vendor-reported single-merchant eyewear case combining AR try-on and interactive 3D viewer. Public release does not disclose sample, comparison construction, randomization or uncertainty. Historical case, not a currently available service recommendation or generative apparel/physical-fit accuracy trial.
- Naegelein, Spann and Molitor / Decision Support Systems: The value of product presentation technologies on mobile vs. non-mobile devices: A randomized field experiment
sciencedirect.com
ReturnStudy details
June 2019 journal publication; underlying experiment historical
Randomized field study with 15,942 products and 22,051 visitors at a European fashion retailer/affiliate platform. Alternative photos, zoom, both or neither are distinct treatments. Public abstract gives directional purchase effects; numerical lift estimates were not verified and are not proposed.
- Baymard Institute: Image resolution and zoom research
baymard.com
ReturnStudy details
April 2020
Historical usability testing and website benchmarking.
- Anuj Kumar and Yinliang (Ricky) Tan / Management Science, INFORMS: The Demand Effects of Joint Product Advertising in Online Videos
pubsonline.informs.org
ReturnStudy details
2012 experiment; published online March 26, 2015; August 2015 journal issue
One US women's apparel retailer. Product-randomized addition of videos showing garments with coordinating accessories over 28 weeks. 66 of 319 principal products assigned video; focal-product analysis excludes cross-exposed products, leaving 58 treated and 239 controls. Difference-in-differences with pre-video, video-on and video-off periods. Outcomes are weekly product unit sales, not visitor conversion, modern AI video or a representative merchant average.
- Gallino and Moreno / INFORMS: The Value of Fit Information in Online Retail
pubsonline.informs.org
ReturnStudy details
Published May 2018
Randomized field experiments comparing availability of virtual fit information. Historical fit/size technology, not a test of modern generative garment imagery. The public abstract gives directions of effects, not numerical effect sizes.
How this report uses research
This report is an editorial synthesis by Fotogenic AI, updated on October 19, 2026. Source dates describe the underlying evidence. Survey responses, measured activity and forecasts are identified separately. Findings are not combined into a new market average. Multiple pages describing one study are treated as one evidence family.
Create with Fotogenic AI
Create a clear gallery treatment
Prepare product-image variations in Fotogenic AI for a defined composition or lighting test, using the same source product.