Ecommerce repeat-purchase and retention statistics
What makes customers return. How to measure repeat buying clearly.

Repeat-purchase rates depend on who entered the cohort, what counts as an order and how long every customer was followed. These statistics separate DTC portfolio benchmarks, subscription survival and a non-subscription retail experiment.
Key takeaways
Set category-specific repeat-purchase expectations. One agency portfolio reported 10-17% across its grouped apparel, beauty/luxury and jewelry brands, compared with 22-44% for consumables. [1]
Build beyond the first subscription order. Recharge reported that 77.2% of 2025 subscription revenue came after it, rather than from new-customer orders. [2]
Protect the relationship behind personalization: 43% of surveyed US and UK consumers said data misuse would make them stop engaging with a brand. [5]
Key facts at a glance
Customers ordering twice within 365 days
18.8%of customers in one DTC agency portfolio had at least two orders in its 365-day lookback.
2026 publication; selected agency 365-day portfolio
BS&CoExtra purchases in a coupon experiment
0.3153additional purchases per customer over ten weeks followed three coupons instead of one in a randomized retail experiment.
2024 paper; one Taiwan vending retailer, 10 weeks
Ta-Wei Huang and Eva Ascarza / Marketing ScienceSubscription cohort reaching a second order
49%of the 2023 subscription cohort reached a second order.
2023 acquisition cohort; subscription order survival
RechargeSubscription revenue after the first order
77.2%of 2025 subscription revenue came after the first order.
2025; subscription revenue, not customer retention
RechargeLoyalty and stated intention to stay
31.3%said a good loyalty program made them more likely to stay with a brand.
2026 survey; stated loyalty preference
AntavoConsumers intending to disengage after data misuse
43%said they would stop engaging with a brand after misuse of their data.
Nov-Dec 2025; 4,000 US/UK consumers, intent
Braze
DTC repeat-purchase benchmarks
18.8% of customers in one DTC agency portfolio had at least two orders in its 365-day lookback. [1]
156,110 customers, weighted by customer count. Selected agency clients, not a representative ecommerce retention average.
22-44% was the reported repeat-purchase range among consumable brands in that portfolio. [1]
Same 365-day lookback and agency sample. Product replenishment changes the purchase opportunity.
10-17% was the reported range for its fashion category. [1]
Publisher groups apparel, beauty/luxury and jewelry together; this is not an apparel-only global benchmark.
7-18% was the reported range for durables and general retail. [1]
Same selected portfolio and lookback. Subscription survival and 90-day acquisition cohorts use different populations and windows.
Subscription order survival and revenue
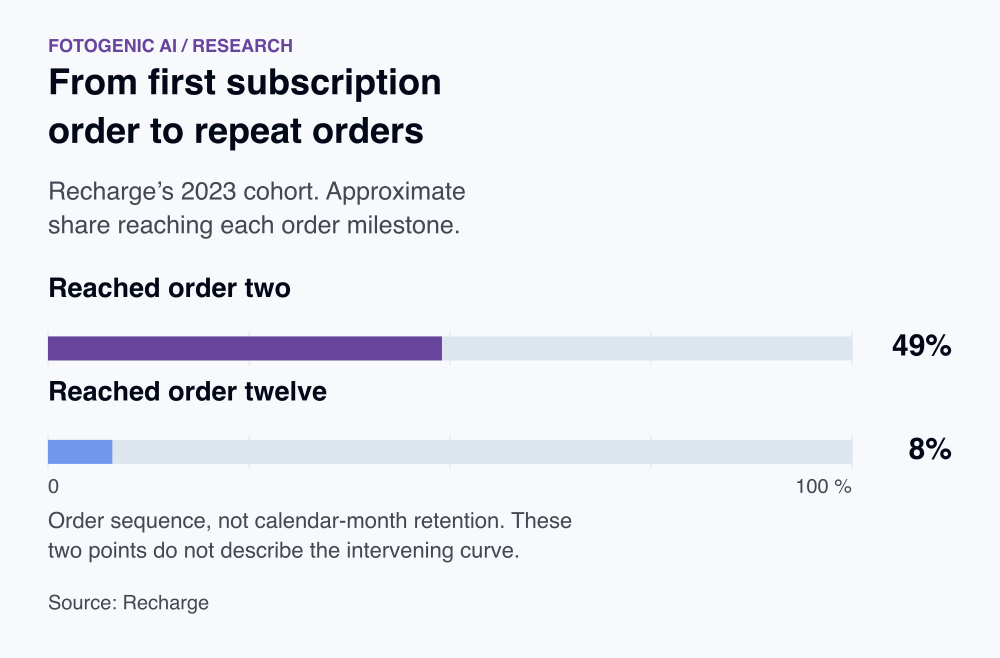
49% of the 2023 subscription cohort reached a second order. [2]
Approximate order-sequence retention reported by Recharge. This is not month-two retention.
8% of Recharge’s 2023 subscription cohort reached a twelfth order. [2]
Approximate figure; subscription cadences vary, so twelve orders need not mean twelve months.
77.2% of 2025 subscription revenue came after the first order. [2]
Revenue share, not the percentage of customers retained.
Loyalty and trust
31.3% said a good loyalty program made them more likely to stay with a brand. [3]
Stated intention, not an observed retention uplift.
3.4% actively opted out of loyalty programs. [3]
Remaining registered does not mean remaining active.
82.6% of marketers believed their programs made customers feel valued. [4]
Marketer perception is one side of the relationship.
56.2% of members said they felt valued by loyalty programs. [4]
Use the perception gap to prompt customer research.
27% of earned loyalty points were left unspent in 2025. [4]
Unredeemed points are not a direct measure of customer churn.
43% said they would stop engaging with a brand after misuse of their data. [5]
4,000 US/UK consumers surveyed late 2025. Stated response, not observed churn or measured retention loss.
Non-subscription repeat-purchase intervention
0.3153 additional purchases per customer over ten weeks followed three coupons instead of one in a randomized retail experiment. [6]
Published 2024 result, p=0.03; 1,853 new customers at one Taiwan food-and-beverage vending operator. Coupons were 15% off and valid for 14 days. Not an apparel or online-store benchmark, retention percentage or profit result.
Define the event, numerator and window
Use a definition that answers the business question. The table gives working definitions for your own reporting; published benchmarks retain their publishers' definitions. Express each ratio as a percentage by multiplying by 100. Shopify's cohort documentation supports following first-purchase groups, but its returning-customer reports can use order history beyond the selected period.
| Metric | Numerator | Denominator | Event and window |
|---|---|---|---|
| Period repeat-purchase rate | Customers with at least two qualifying orders in the period | Customers with at least one qualifying order in the same period | Use the same purchase event and reporting period |
| Customer-cohort retention | Original cohort customers with another qualifying purchase in the follow-up interval | Original first-purchase cohort customers with complete follow-up | Specify the first-purchase cohort and its later observation interval |
| Subscription-cohort churn | Opening subscriptions that are inactive at the interval end | Active subscriptions at the interval start | Define inactive status and follow the same opening subscriptions |
| Repeat-order revenue share | Net revenue from repeat orders in the period | Net revenue from all qualifying orders in the same period | Specify the prior-purchase rule and refund treatment |
| Customer-cohort revenue retention | Net revenue from the original customer cohort in the follow-up interval | Net revenue from that cohort in the base interval | Use equal-length intervals and exclude newly acquired customers |
For follow-up imagery of the same product: build a consistent clothing catalogue.
Keep customer identity and purchase events consistent
Count each customer once in a customer-based numerator, using confirmed account or identity links. Treat exchanges, replacement shipments and split fulfillment consistently so operational events do not become extra purchases. Set cancellation and refund rules before comparing cohorts.
For subscription churn, state how pauses, failed payments and cancellations change active status. A missing status is not evidence of retention. Keep loyalty enrollment separate from a qualifying purchase, and leave a metric unavailable when its denominator or follow-up cannot be established.
Prepare a consistent collection for returning buyers: plan useful lifestyle product images.
Match the follow-up to the product
Allow a normal reorder opportunity for replenishable goods. Durable-goods customers may need an accessory or another category long before replacing the original item. A monthly subscription churn definition does not describe those purchases.
Review product accuracy, delivery and the relevance of the next recommendation alongside repeat orders. Report unique returning customers, net repeat-order revenue and contribution separately. A few large orders can raise revenue without increasing the share of customers who return.
The campaign set generator can help plan a coordinated product story; it does not measure customer retention.
What a completed retention experiment specifies
The published coupon trial has a defined first-purchase cohort, a business-as-usual control and a follow-up that extends beyond the incentive. It provides direct evidence about repeat purchases in a non-subscription setting. Product, channel and purchase frequency still limit transfer to an apparel store.
| Study field | Published intervention | Merchant decision |
|---|---|---|
| Eligibility | Customers immediately after their first purchase | Freeze the first-order cohort before assigning an offer |
| Treatment and control | Three 15% coupons versus one; both expire after 14 days | Compare with the offer customers would otherwise receive |
| Follow-up | Ten weeks; 0.3153 additional purchases per customer | Track beyond promotion expiry, including costs and refunds |
Build an acquisition cohort with equal follow-up
Group customers by first qualifying order month and keep the customer identifier stable. Choose the follow-up window before examining results, then include only cohorts old enough to complete it. Record a second qualifying order and contribution per acquired customer, including customers who never buy again.
For apparel, separate repeat buying from replacement after a return and exclude cancelled or fully refunded orders consistently. A customer may buy seasonally without declaring a cancellation. Use purchase history and category cadence to decide when a reminder is useful rather than treating silence as confirmed churn.
FAQ
Questions about the research
One BS&Co agency portfolio reported 18.8% of 156,110 customers had at least two orders in a 365-day lookback. Reported ranges were 22-44% for consumables, 10-17% for its fashion grouping and 7-18% for durables/general retail. These selected-client ranges are context, not universal targets or fixed-horizon acquisition-cohort retention.
Sources and method
- BS&Co: Repeat Purchase Rate Benchmarks: 18.8% Across 156K Customers
bsandco.us
ReturnStudy details
February 14, 2026 publication; 365-day lookback
Agency-managed DTC portfolio, 156,110 customers across 10+ verticals, weighted by customer count. Repeat customer means at least two orders in a 365-day lookback, not a fixed follow-up period after each first order. Exact calendar dates and brand count are undisclosed. Category ranges reflect selected portfolio brands. Timing sections use inconsistent repeat-buyer totals, so timing statistics are excluded here.
- Recharge: Subscription renewals and the 2023 subscriber cohort
getrecharge.com
ReturnStudy details
2023 cohort and 2023-2025 revenue; updated August 2026
Platform analysis of more than 20,000 subscription brands. Order-sequence retention differs from calendar-month retention; revenue excludes tax. Not a benchmark for all ecommerce stores.
- Antavo: Global Customer Loyalty Report 2026 announcement
antavo.com
ReturnStudy details
February 2026
Global marketer and loyalty-member survey. Intent is not observed retention. Same underlying study as Antavo’s report page, not independent corroboration.
- Antavo: Global Customer Loyalty Report 2026 findings
antavo.com
ReturnStudy details
2026 report
3,000 professionals, 10,000 loyalty members and a separate platform activity dataset. Multiple public pages describe this same research; they are one evidence family, not independent corroboration.
- Braze: 2026 Global Customer Engagement Review
braze.com
ReturnStudy details
Surveys November-December 2025; published February 2026
Separate surveys of 2,200 marketing executives at B2C companies with at least $10M annual revenue and 4,000 US/UK consumers. Behavioral dataset: 779 customers during 2025. Consumer trust answers are stated intent, not measured churn.
- Ta-Wei Huang and Eva Ascarza / Marketing Science: Doing More with Less: Overcoming Ineffective Long-Term Targeting Using Short-Term Signals
evaascarza.com
ReturnStudy details
Published online March 6, 2024; July-August 2024 journal issue; experiment calendar dates not stated in cited section
Published paper, pages 865-866, sections 2.1-2.2. One Taiwan retail-technology company selling food and beverages through self-service vending machines. 1,853 newly acquired customers randomized: 889 received three 15% coupons and 964 one 15% coupon, all expiring after 14 days. Ten-week additional-purchase ATE is 0.3153, p=0.03. Non-subscription intervention, not an apparel/ecommerce retention benchmark. Experiment calendar dates are not stated in the cited section.
- Shopify Help Center: Customer reports
help.shopify.com
ReturnStudy details
Current documentation checked October 19, 2026
Official documentation groups customer cohorts by first-order date and observes subsequent purchase periods. Native returning-customer reports can use the customer’s entire order history, so their event definitions may differ from a fixed-period repeat-purchase measure.
How this report uses research
This report is an editorial synthesis by Fotogenic AI, updated on October 19, 2026. Source dates describe the underlying evidence. Survey responses, measured activity and forecasts are identified separately. Findings are not combined into a new market average. Multiple pages describing one study are treated as one evidence family.
Create with Fotogenic AI
Keep the returning shopper's product context clear
Use Fotogenic AI to create catalogue and lifestyle scenes for the collection your customers will revisit. Plan images around the garment information missing from the page.