Cart abandonment statistics
Why shoppers leave before paying. Where to look for avoidable friction.
Cart abandonment is common, but the reasons matter more than a single pooled rate. Cost, account creation, delivery and payment friction point to different fixes; recovery-message revenue measures only identified recipients.
Key takeaways
A cart is not always a ready buyer: 42% of US shoppers reported abandoning because they were browsing or not ready to purchase. [7]
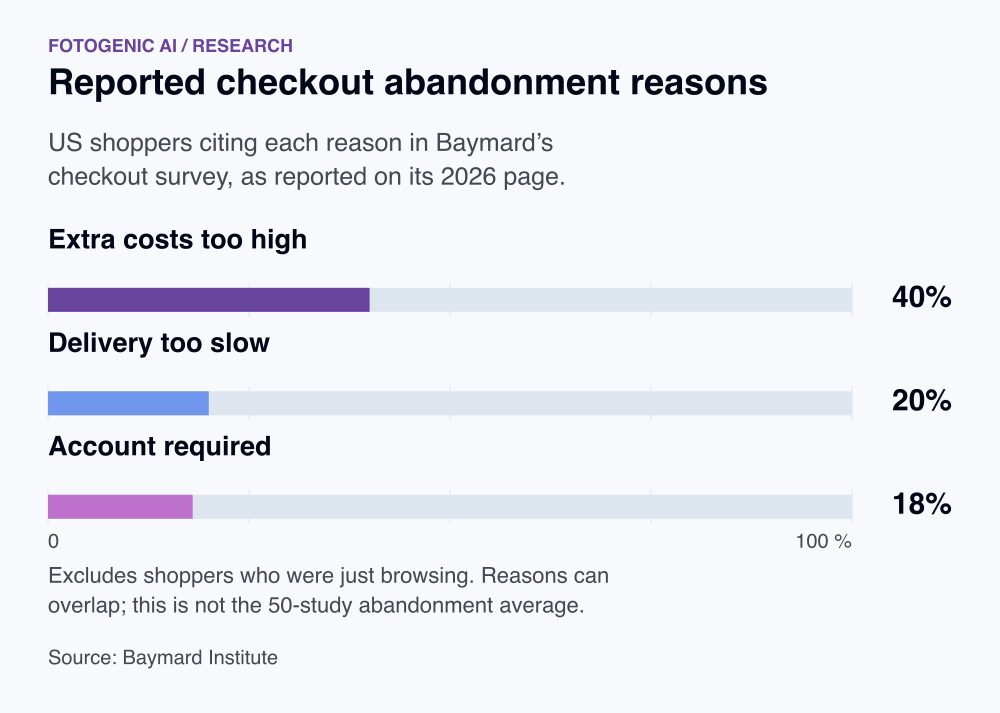
Show total costs and delivery early. In Baymard's reason survey excluding just-browsing abandoners, 40% cited extra costs and 20% cited slow delivery. [1]
Evaluate recovery flows on retained orders. The USD 6.77 email-cart benchmark is attributed revenue per recipient, before the costs and refunds in your own business. [6]
Key facts at a glance
Average abandonment across 50 studies
70.22%was the average abandonment rate across 50 published studies.
Pooled 50-study rate; mixed years and methods
Baymard InstituteShoppers citing high extra costs
40%cited high extra costs as an abandonment reason.
2026 page; US reason survey, not pooled carts
Baymard InstituteAttributed cart-email revenue per recipient
$6.77was average email abandoned-cart revenue per recipient.
2026 report; attributed revenue, dates unspecified
KlaviyoShoppers citing slow delivery
20%cited slow delivery.
2026 page; US reported checkout reason
Baymard InstituteShoppers citing account creation
18%cited being required to create an account.
2026 page; US reported checkout reason
Baymard InstituteShoppers browsing without buying intent
42%of US online shoppers reported abandoning because they were browsing or not ready to buy.
2026 page; US shoppers, three-month recall
Baymard Institute
Abandonment and checkout quality
70.22% was the average abandonment rate across 50 published studies. [1]
The studies cover different years, markets and methods.
67% of benchmarked sites omitted a total-order-cost estimate near the buy section. [2]
A product-page information gap. It does not mean 67% of shoppers abandoned.
65% of benchmarked checkout flows scored mediocre or worse. [3]
344 leading US/EU sites in Baymard’s public checkout benchmark. This is site prevalence, not the proportion of shoppers who abandoned.
Why shoppers leave
40% cited high extra costs as an abandonment reason. [1]
Baymard’s checkout-reason survey excludes the just-browsing segment.
20% cited slow delivery. [1]
A survey reason does not quantify the sales recovered by faster shipping.
18% cited being required to create an account. [1]
Check the actual guest-checkout path before changing campaign messaging.
62% said they would abandon without their preferred payment method. [4]
DHL’s 2026 global preference question differs from Baymard’s past-behavior question.
81% said they would abandon without their preferred delivery option. [5]
A stated shopper intention from 2025, not the observed abandonment rate.
79% said they would leave if returns did not meet expectations. [5]
Different survey and question from Baymard’s checkout-reason percentages.
Recovery-flow revenue
$6.77 was average email abandoned-cart revenue per recipient. [6]
Vendor-attributed flow revenue. Recipients are reachable identified shoppers, not every abandoned cart.
$13.70 was email abandoned-cart revenue per recipient among the top 10% of brands. [6]
Selected upper performance group in the same dataset, not an expected result for a new store.
$4.48 was average text-message abandoned-cart revenue per recipient. [6]
Different channel audience and costs from email. The public article does not disclose the attribution window.
Browsing intent and checkout complexity
42% of US online shoppers reported abandoning because they were browsing or not ready to buy. [7]
Recall covers the preceding three months. This is a respondent reason, not 42% of all abandoned carts or a quantity to subtract from pooled abandonment.
17% reported abandoning an order because checkout was too long or complicated. [7]
Recall covers the preceding quarter. It identifies reported friction, not the conversion lift achievable by removing a particular field.
Calculate one defined cart rate
Cart abandonment rate = abandoned eligible carts / eligible carts created × 100. Count distinct carts, rather than item additions. For your own report, define an abandoned cart as an eligible cart without a linked qualifying completed order by the end of its follow-up window.
Choose a cart identifier, a cart-creation period and a fixed time allowed for completion after creation. State when a changed or restored cart becomes a new cart. Compare cohorts only after each has completed that follow-up. Apply the same bot and test exclusions throughout; if there are no eligible carts, leave the rate unavailable.
Improve the product information shoppers return to: audit the product gallery.
Keep cart and checkout denominators separate
Shopify distinguishes adding an item from starting checkout. Use the working definitions below to keep those stages separate, and record how each cart or checkout links to an order. A reminder flow has another denominator: people eligible to receive that message.
Choose the completion event consistently, including how cancelled or refunded orders affect it. These operating definitions need not match the native report in your platform, so reconcile its event rules before comparing rates.
| Measure | Denominator | Completion check |
|---|---|---|
| Cart abandonment | Distinct eligible carts created in the cohort | Linked qualifying order within the cart follow-up window |
| Checkout abandonment | Distinct eligible checkouts started in the cohort | Linked qualifying order within the checkout follow-up window |
| Reminder order rate | Eligible recipients of the selected reminder | Attributed order under the stated message window |
Keep recovery creative aligned: check Shopify variant images.
Fix the failed step before increasing reminders
Inspect total cost, delivery timing, payment availability and guest checkout before expanding recovery messages. Check that the cart shows the selected variant and makes bundles clear. A browsing shopper and a shopper blocked by a reproducible payment error need different interventions.
Use the reason evidence to prioritize investigation. Its percentages cannot be subtracted from the pooled abandonment rate because their denominators differ. Test the affected step against a comparable eligible cohort and report qualifying completed orders with the same cancellation and refund rules.
Use the AI product photography guidance to resolve visual uncertainty before testing recovery messages.
Investigate the friction your funnel actually records
Baymard’s extra-cost finding points to a cost-visibility test, not an image test. Compare the current experience with a clear total-cost estimate near the product’s buying controls for destinations where costs can be calculated. Preserve the product, offer and payment choices.
Link distinct cart IDs to checkout starts and qualifying orders. Keep initial completion and later retained orders as separate outcomes, so refunds do not silently change the purchase event. A gallery correction belongs in a separate test when the selected color, bundle contents or product detail is the observed problem.
| Recorded issue | Change to investigate | Outcome to follow |
|---|---|---|
| Unexpected delivery or extra charge | Show a calculable order-cost estimate before checkout | Completed orders per eligible cart and retained contribution |
| Required account or repeated sign-in | Verify guest checkout and account-recovery behavior | Successful checkout completion among affected entrants |
| Wrong color or unclear bundle in cart | Correct variant mapping or the relevant product view | Item-mismatch contacts and returns, alongside orders |
FAQ
Questions about the research
Baymard’s pooled estimate is 70.22% across 50 published studies. That combined reference does not mean seven in ten carts can be recovered. Diagnose cost, delivery, payment and account friction first, then measure reminders among eligible identified shoppers separately from the total cart population.
Sources and method
- Baymard Institute: Cart abandonment research
baymard.com
ReturnStudy details
2026 page; mixed-year studies
50-study aggregate plus separate US checkout-reason survey. Different denominators.
- Baymard Institute: Product Page UX 2026: 10 Pitfalls and Best Practices
baymard.com
ReturnStudy details
March 2026 benchmark update
155+ benchmarked sites and 30,000+ manually reviewed product-page UX scores. Site prevalence, not shopper conversion.
- Baymard Institute: Cart and checkout usability benchmark
baymard.com
ReturnStudy details
Public benchmark checked October 18, 2026
Checkout assessment of 344 leading US/EU ecommerce sites; site UX scores are not customer abandonment rates. The page’s aggregate abandonment headline differs from Baymard’s separate current study list, so that older headline is not used.
- DHL: E-Commerce Trends Report 2026
group.dhl.com
ReturnStudy details
June 2026 release
29,000 shoppers and 5,800 businesses across 29 countries. Survey responses.
- DHL: E-Commerce Trends Report 2025
group.dhl.com
ReturnStudy details
February-March 2025
24,000 recent online shoppers across 24 markets. Survey responses.
- Klaviyo: The abandoned cart benchmarks report: 2026 data to inform your strategy
klaviyo.com
ReturnStudy details
October 2, 2026 publication
Analysis of more than 110,000 Klaviyo customers across industries. Average and top-decile brand flow metrics are distinct. Public article does not specify exact collection dates, per-flow sample counts or attribution windows. Revenue per recipient is vendor-attributed revenue, not incremental recovery or profit.
- Baymard Institute: Reasons for cart abandonment
baymard.com
ReturnStudy details
Reasons section labelled 2026; page also retains older update metadata
US online shoppers reporting abandonment in the preceding three months. Current public article does not disclose exact fieldwork dates or sample size for these two questions. Reasons can overlap. This page retains an older pooled-abandonment headline; that headline is not used here.
- Shopify: How To Reduce Shopping Cart Abandonment (2026)
shopify.com
ReturnStudy details
2026 guide, checked October 19, 2026
Official explanation of cart abandonment, checkout abandonment and abandoned carts divided by carts created. Used for metric definitions. Cart identity, qualifying orders and follow-up windows must be specified separately when applying the formula.
- Gordon and coauthors / INFORMS: A Comparison of Approaches to Advertising Measurement
pubsonline.informs.org
ReturnStudy details
2019 publication
15 US Facebook randomized advertising experiments; 500 million user-experiment observations, not unique people. Compares observational estimates with experimental effects, not a present-day channel CPA benchmark.
How this report uses research
This report is an editorial synthesis by Fotogenic AI, updated on October 19, 2026. Source dates describe the underlying evidence. Survey responses, measured activity and forecasts are identified separately. Findings are not combined into a new market average. Multiple pages describing one study are treated as one evidence family.
Create with Fotogenic AI
Keep the product clear from gallery to cart
Use Fotogenic AI for the product scenes your gallery needs, then check that the selected variant and bundle contents remain clear in the cart.