Shopify statistics: merchant growth and checkout
The scale behind the storefront. What platform numbers really measure.

Shopify GMV, website usage and checkout studies measure different parts of the platform. This report focuses on Shopify merchant activity and product-media decisions, with one matched Shopify/WooCommerce website comparison.
Key takeaways
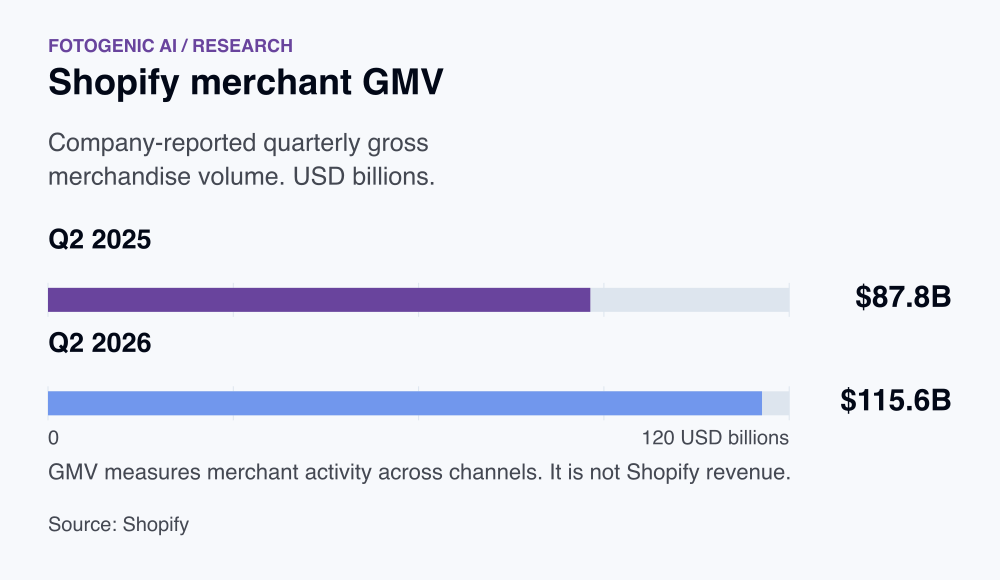
Shopify reported USD 115.6 billion in merchant GMV for Q2 2026. GMV measures merchant transactions, distinct from Shopify's own revenue. [1]
Review the checkout claim within its original comparison. Shopify's reported 15% advantage is relative, commissioned research from 2023, rather than a guaranteed store result. [5]
Prepare product assets for their destination. Shopify permits product and collection images up to 25 megapixels, an upload limit rather than a recommended export size. [6]
Key facts at a glance
Merchant GMV in Q2 2026
$115.6Bin merchant GMV was reported for Q2 2026.
Shopify merchant GMV, Q2 2026
ShopifyMerchant GMV across full-year 2025
$378.4Bwas full-year merchant GMV in 2025.
Shopify merchant GMV, full-year 2025
Shopify / SECReported relative checkout advantage
15%was Shopify’s reported average relative checkout conversion advantage.
2023 commissioned relative checkout comparison
ShopifyComparable Q2 2025 merchant GMV
$87.8Bwas the comparable Q2 2025 GMV.
Shopify merchant GMV, comparable Q2 2025
ShopifyRetailers selling on three or more platforms
63%of surveyed retailers sold on at least three platforms.
2025 DHL retailer channel survey
DHLMerchant GMV during 2025 BFCM
$14.6Bin global merchant GMV was reported for Shopify's 2025 BFCM weekend.
Global merchant BFCM GMV, 2025
Shopify
Merchant sales and platform reach
$115.6B in merchant GMV was reported for Q2 2026. [1]
Rounded from $115.567 billion. GMV spans supported sales channels.
$87.8B was the comparable Q2 2025 GMV. [1]
Rounded from $87.837 billion. Compare like-for-like quarters, not a quarter with a year.
$3.58B was Shopify revenue in Q2 2026. [1]
Platform revenue is a different measure from merchant sales volume.
34% year-over-year revenue growth was reported for Q2 2026. [1]
This describes Shopify, not the average merchant on the platform.
$378.4B was full-year merchant GMV in 2025. [2]
Rounded annual figure. It is not platform revenue or merchant profit.
175+ countries were served by Shopify’s merchant base. [3]
Company facts checked October 2026. Country availability does not establish local merchant counts.
Over 14% was Shopify’s reported share of US ecommerce sales. [3]
Based on 2025 merchant US GMV excluding POS, compared with US Census ecommerce sales. Not a share of all websites.
Channel mix and checkout
63% of surveyed retailers sold on at least three platforms. [4]
Cross-platform business context; this is not Shopify market share.
15% was Shopify’s reported average relative checkout conversion advantage. [5]
Historical commissioned comparison from 2023; not a 15 percentage-point gain or a promise for a migration.
Up to 50% was the reported Shop Pay conversion advantage over guest checkout. [5]
An upper-bound result from the same commissioned research, not an average store outcome.
25 MP is the documented maximum product or collection image resolution. [6]
Technical upload ceiling, not a recommendation to serve a 25-megapixel image to every shopper. File size must also stay below 20MB.
Peak trading, payments and international orders
$14.6B in global merchant GMV was reported for Shopify's 2025 BFCM weekend. [7]
Includes online and offline merchant sales, net of refunds but including specified taxes and shipping. It is not Shopify revenue or a US ecommerce-only total.
32% of reported BFCM orders used Shop Pay. [7]
A seasonal payment share in Shopify's 2025 global merchant data. Share of orders is different from checkout conversion advantage.
16% of global BFCM orders were cross-border. [7]
Reported for one holiday weekend. This is an order share, not the share of revenue, merchants or shoppers trading internationally.
Platform usage with defined denominators
5.3% of websites in W3Techs' survey used Shopify on October 19, 2026. [8]
All-websites denominator. Shopify's known-CMS share was 7.9%; neither metric measures active merchants or GMV. Daily table may change.
7.8% of websites in the same W3Techs snapshot used WooCommerce. [8]
Equivalent all-websites denominator to Shopify 5.3%. WooCommerce's known-CMS share was 11.5%; not commerce-only share or business counts.
App ecosystem and Plus capabilities
Over 16,000 apps were advertised on Shopify’s public App Store page. [9]
Publisher’s lower bound checked October 19, 2026, not an independently recounted directory. App availability is not installations, active developers, merchant count or proof of integration quality.
Over $1.3B was paid to developers across Shopify’s ecosystem in 2025. [10]
Company-reported prior-year payout in its April 28, 2026 release. It is not developer profit, merchant revenue or average developer earnings.
9 expansion stores are supported by the documented Shopify Plus plan. [11]
Plan capability checked October 19, 2026, not observed stores per merchant or an enterprise-customer count. Each live expansion store needs its own theme license.
Read platform scale without inferring merchant success
Gross merchandise volume measures activity processed by merchants on the platform. It is different from Shopify revenue and from the revenue of any individual store. Comparing a quarterly GMV figure with annual revenue, or with another platform’s differently defined volume, would produce a misleading conclusion.
Prepare product media and variant assignments: assign Shopify clothing images to the right variant.
Evaluate the media workflow end to end
Use the manual route documented in the Fotogenic AI Shopify guide: download an approved image, upload it to the product gallery and assign the relevant image to the variant. Review the storefront after assignment. Store size, app counts and checkout benchmarks cannot confirm that the selected color displays correctly.
| Step | Product-media check |
|---|---|
| Source and output | Keep the original product photo and the approved export together |
| Gallery upload | Use the intended product, image order and descriptive alt text |
| Variant assignment | Select each similar color and confirm its assigned product view |
| Storefront review | Check phone and desktop selection, image loading and the matching cart item |
Keep source files and approved versions organized: plan consistent catalogue images.
Prepare payment and international product context
Shop Pay order share and cross-border order share answer different questions from checkout conversion. For international product pages, keep selected variants, units, delivery information and available media consistent. A campaign should lead to the product that can actually be bought in the destination market.
Shopify's holiday figures include offline as well as online merchant activity. Use them as platform context, then inspect your own channel and market mix before setting gallery, translation or payment priorities.
Check the supported access routes on the ecommerce platforms page when planning where image production fits your store.
What does Shopify market share measure?
Website detection, active merchants and merchant sales are different measures. W3Techs compares Shopify and WooCommerce using the same all-websites and known-CMS denominators. Shopify's disclosed GMV answers a different question. A detected installation can exist without proving current sales.
| Platform | Share of all websites | Snapshot definition |
|---|---|---|
| Shopify | 5.3% | W3Techs, October 19, 2026 |
| WooCommerce | 7.8% | Same provider, date and denominator |
FAQ
Questions about the research
Shopify reported $115.6 billion in merchant GMV for Q2 2026 and $378.4 billion for the full year 2025. GMV describes platform-defined merchant transaction volume. It is separate from Shopify’s own revenue and does not subtract individual merchants’ product, marketing, return or operating costs.
Sources and method
- Shopify: Second-quarter 2026 results
shopify.com
ReturnStudy details
Quarter ended June 30, 2026
Company-reported results, USD. GMV includes multiple sales channels.
- Shopify / SEC: 2025 annual filing
sec.gov
ReturnStudy details
Year ended December 31, 2025
Company annual filing. Merchant GMV is distinct from platform revenue.
- Shopify: Company facts and milestones
shopify.com
ReturnStudy details
Company facts checked October 18, 2026
Company-reported scale. US ecommerce share uses merchant sales, not the share of websites or merchant success rates. Approximate merchant counts must not be turned into precise active-store totals.
- DHL: E-Commerce Trends Report 2025, Business Edition
group.dhl.com
ReturnStudy details
October 2025 release
Survey of 4,050 ecommerce businesses in 19 markets. Business self-reports and plans, not transaction records or shopper responses.
- Shopify: Checkout conversion research
shopify.com
ReturnStudy details
April 2023 commissioned study
Vendor-published results of external consulting research. Comparative checkout conversion is not whole-store conversion; the public summary does not provide the full matched merchant sample. Historical, not a 2026 experiment.
- Shopify Help Center: Product media types and image requirements
help.shopify.com
ReturnStudy details
Documentation checked October 18, 2026
Current upload requirements and presentation guidance, not a study of optimal image sizes or conversion. Images must remain below 20MB and within 25 megapixels; delivery and display depend on the theme and Shopify image service.
- Shopify: 2025 Black Friday-Cyber Monday merchant results
shopify.com
ReturnStudy details
November 28-December 1, 2025 weekend; December 2 release
Approximate unaudited global merchant data, including online and offline sales. GMV is net of refunds and includes shipping, handling, duties and VAT. Customer count uses unique buyer emails starting in 2025. Methodology can change across years; not Shopify corporate revenue or a typical merchant result.
- W3Techs / Q-Success: Comparison of the usage statistics of WooCommerce vs. Shopify for websites
w3techs.com
ReturnStudy details
Daily table dated October 19, 2026
Technology-detection survey of over 20 million relevant websites under W3Techs methodology. Empty, duplicate and redirected sites are excluded; subdomains are not separate sites. All-websites usage and known-CMS share have different denominators. Not active merchants, independent businesses or GMV share. Reports update daily; individual sites are not necessarily recrawled daily.
- Shopify App Store: The Shopify app advantage
apps.shopify.com
ReturnStudy details
Current public store page checked October 19, 2026
Company-advertised lower bound of more than 16,000 available apps. Not an independently recounted directory, installed-app total, developer population or active-merchant count. A lower-bound statement alone cannot establish growth or contraction.
- Shopify: The developers behind Shopify's $1.3 billion app ecosystem
shopify.com
ReturnStudy details
April 28, 2026 release describing 2025 developer payouts
Company-reported amount paid to developers across Shopify’s ecosystem in the prior year. Not developer profit, Shopify corporate revenue, merchant sales or a mean per developer. Public article does not supply a detailed payout accounting reconciliation.
- Shopify Help Center: Shopify Plus plan
help.shopify.com
ReturnStudy details
Current plan documentation checked October 19, 2026
Official plan capabilities, not a count of enterprise merchants. Plus supports 9 expansion stores, with a theme license needed for each live expansion store. Current documentation says B2B is available on all plans and identifies additional Plus capabilities including unlimited catalogs, direct assignment to companies/locations, deposits, partial payments and payment requests per fulfillment. Plan and contract terms can change.
How this report uses research
This report is an editorial synthesis by Fotogenic AI, updated on October 19, 2026. Source dates describe the underlying evidence. Survey responses, measured activity and forecasts are identified separately. Findings are not combined into a new market average. Multiple pages describing one study are treated as one evidence family.
Create with Fotogenic AI
Prepare product images for your Shopify gallery
Create product scenes in Fotogenic AI, then use the documented download, upload and variant-assignment workflow for your store.