Mobile commerce statistics
How shoppers buy on their phones. What a smaller screen needs to do.

Mobile commerce includes phone websites, shopping apps and tablets. A dated global spending baseline, full-year German device sales and app activity show different parts of the market, alongside conversion and product-page evidence.
Key takeaways
Build the phone journey as a primary shopping route. Smartphones represented 61% of German ecommerce sales value in 2025 and 56.4% of US holiday online spending. [8][1]
Test both the app and browser experience. German smartphone online purchases were split evenly between apps and the web in the 2025 estimate. [8]
Give shoppers usable images and controls at phone size. Only 38% of mobile sites reached decent or good product-page UX in Baymard's 2026 benchmark. [2]
Key facts at a glance
Global ecommerce spending via smartphones
57%was smartphones’ share of global ecommerce spending in Worldpay’s 2024 estimate.
Full-year global spending estimate, 2024
WorldpayGerman sales value via smartphones
61%of German ecommerce sales value came through smartphones in 2025.
2025 German ecommerce sales-value estimate
HDE and IFH KölnApp share of German smartphone purchases
50%was the reported app share of smartphone online purchases in Germany in 2025.
2025 German smartphone purchase split
HDE and IFH KölnUS holiday spending via smartphones
56.4%of US holiday online spending came through smartphones in 2025.
US smartphone spending, Nov-Dec 2025
AdobeMobile sites with decent or good UX
38%of benchmarked mobile sites achieved decent or good product-page UX.
Baymard 2026 evaluated mobile sites
Baymard InstituteMobile luxury conversion
0.9%was the mobile luxury conversion rate.
Luxury mobile conversion, 2026 summary
Contentsquare
Smartphone sales and seasonal peaks
56.4% of US holiday online spending came through smartphones in 2025. [1]
This is spending share during November-December, not mobile traffic share.
54.5% was the smartphone spending share in the 2024 holiday period. [1]
The comparison uses equivalent seasonal windows.
66.5% of online spending on Christmas Day came through smartphones. [1]
A single-day spending share, with no full-year coverage.
61.6% was the smartphone share on Thanksgiving. [1]
Shopping context can change device mix within the same season.
Mobile experience and conversion
38% of benchmarked mobile sites achieved decent or good product-page UX. [2]
A researcher-assessed usability benchmark, not a mobile conversion rate.
3.4% was the mobile health and beauty conversion rate. [3]
Category-specific retail conversion, measured differently from holiday revenue share.
0.9% was the mobile luxury conversion rate. [3]
Different purchase cycles and intent can explain category differences; this is not an experiment.
1.4% was desktop luxury conversion in the same Contentsquare summary as the 0.9% mobile figure. [3]
Matched device/category context. Luxury is not representative of health and beauty or all ecommerce.
Payments and returns
56% of global ecommerce transaction value used digital wallets in 2025. [4]
Includes desktop and mobile payments. It is not the share of spending made on a phone.
82.2% of US holiday BNPL purchases were made through smartphones. [1]
November-December 2025. The denominator is BNPL purchases, not all orders.
38.8% of US holiday returns were initiated through a mobile device. [1]
Device share of returns differs from device share of online spending; neither is a mobile return rate.
App shopping and performance outside holiday totals
72% of DHL-surveyed shoppers identified with mainly shopping through retailer or marketplace apps. [5]
Page 5 app-first profile. Includes marketplace apps; it is not app share of all ecommerce sales or evidence that a merchant needs its own app.
38% of DHL-surveyed businesses offered browsing and buying through their own app. [5]
A separate business population from the shopper profile. Subtracting the percentages would not measure unmet customer demand.
33.13% relative conversion improvement was reported in Rakuten 24's performance A/B test. [6]
One historical landing-page experiment, not an app-versus-web trial. Several delivery optimizations changed together; public sample size and uncertainty are not disclosed.
Wallets by market and age
40% of US ecommerce spending used digital wallets in 2025. [7]
Share of transaction value in Worldpay's regional estimate. A wallet can fund a purchase on desktop or phone; it is not smartphone sales share.
77% of Asia-Pacific ecommerce spending used digital wallets in 2025. [7]
Same value-based framework as the US 40% figure. Regional payment ecosystems differ; this is not one universal mobile checkout mix.
39% of US respondents aged 18-24 named wallets their most-used online payment method. [7]
GlobalData Q2 2025 survey; US age-subgroup size undisclosed. Preference share differs from the regional transaction-value estimates.
Full-year devices and shopping apps
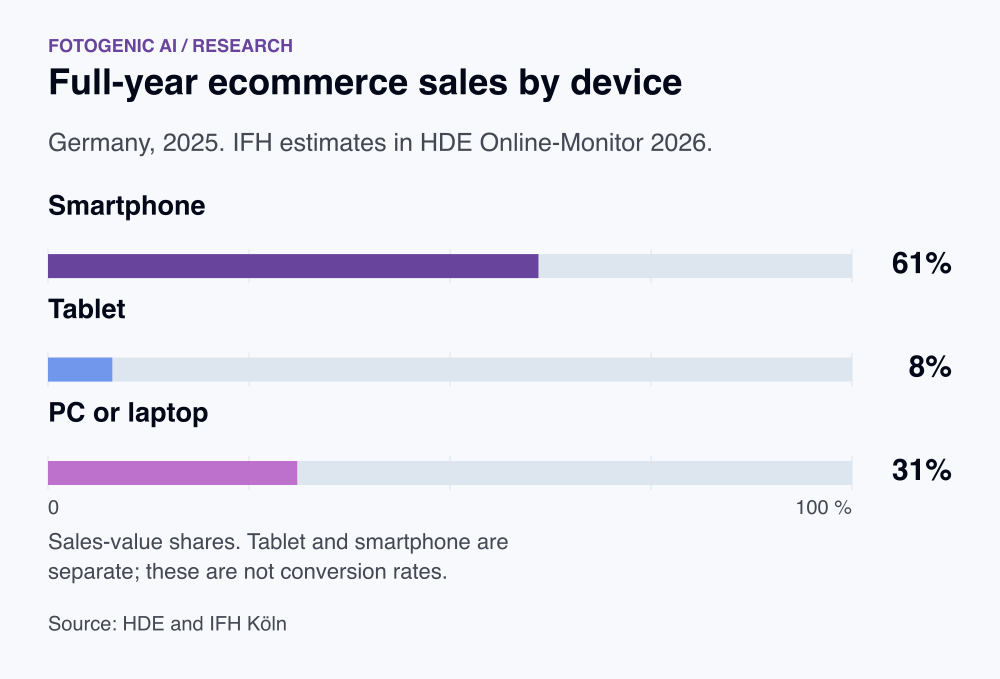
61% of German ecommerce sales value came through smartphones in 2025. [8]
Full-year IFH estimate; tablets are separate.
8% of the same German ecommerce sales value came through tablets. [8]
Same 2025 device distribution as smartphone and PC/laptop shares.
31% of the same German ecommerce sales value came through PCs or laptops. [8]
Same full-year market estimate, not device conversion.
50% was the reported app share of smartphone online purchases in Germany in 2025. [8]
The other half used mobile websites. App purchases are not separated into marketplace and own-store apps.
5% was year-over-year ecommerce-app session growth in Adjust’s 2025 benchmark. [9]
Provider app cohort; session growth does not measure orders or sales.
57% was smartphones’ share of global ecommerce spending in Worldpay’s 2024 estimate. [10]
Full-year global transaction-value baseline published in 2025; not wallet share or a current 2026 estimate.
Do not confuse mobile spending with mobile conversion
Smartphone revenue share describes where recorded spending occurred. It does not describe the share of visits, the conversion rate of those visits or the number of customers who researched on a different device. A large spending share can coexist with substantial mobile friction.
Check legibility and framing on a phone: prepare Google Shopping product images.
Prioritize the first useful product view
The first image should make the selected item identifiable without an awkward crop. Check whether shoppers can inspect detail, change the variant and return from zoom without losing their place. A decorative hero that delays the useful view should earn its place through a clear purpose.
Check the selected product variant on a phone: check the product-to-variant image mapping.
Decide whether the app comparison fits your audience
Worldpay supplies a dated full-year global spending baseline, the German series supplies a newer regional device distribution and the US figures describe a holiday period. The app split concerns smartphone purchases, while Adjust measures app sessions. None supplies a matched causal app-versus-web conversion result.
Before commissioning an owned app, evaluate the repeat purchase task, reachable customers and operating cost. Marketplace use alone does not demonstrate demand for another store app. For an existing phone website, verify the selected variant, readable detail view, zoom return and payment completion.
Plan mobile galleries through the product catalogue images workflow, retaining complete product views.
Choose wallets for the destination market
Worldpay's US 40% and Asia-Pacific 77% wallet spending shares describe different payment environments. A wallet can be funded by a card, bank account or balance and can work on several device types. Inspect payment availability, selected currency and completion on the mobile devices your shoppers use.
FAQ
Questions about the research
Worldpay estimated smartphones generated 57% of global ecommerce spending in 2024. HDE and IFH estimate 61% of German ecommerce sales value came from smartphones in 2025. Adobe measured a 56.4% smartphone share of US online spending in November-December 2025. These figures cover different periods and markets, so they should be read separately. App purchases, browser sessions and digital-wallet payments also need separate definitions.
Sources and method
- Adobe: 2025 holiday shopping results
news.adobe.com
ReturnStudy details
November-December 2025; January 2026 release
US online retail analytics covering over one trillion visits.
- Baymard Institute: Product Page UX 2026: 10 Pitfalls and Best Practices
baymard.com
ReturnStudy details
March 2026 benchmark update
155+ benchmarked sites and 30,000+ manually reviewed product-page UX scores. Site prevalence, not shopper conversion.
- Contentsquare: 2026 retail conversion benchmarks
contentsquare.com
ReturnStudy details
Updated February 12, 2026
Retail subset of the 2026 Digital Experience Benchmarks. This public summary does not disclose the eligible retail sample or exact comparison window. Device and category results must stay separate.
- Worldpay / Global Payments: Global Payments Report 2026: digital wallets
worldpay.com
ReturnStudy details
2025 transaction value; 2026 report
Global payment-method analysis. Share is transaction value, not transaction count, smartphone share or a randomized checkout effect. Regional funding and acceptance differ.
- DHL eCommerce: 2026 E-Commerce Trends Report, full research and methodology
dhl.com
ReturnStudy details
Fieldwork December 2025-February 2026
29,000 recent online shoppers in 29 countries and 5,800 businesses in 28 countries; 1,000 shoppers per country. Grocery, tickets and flights excluded. Shopper and business responses are distinct. Cited findings appear on pages 5, 30 and 42; methodology is on page 78. The try-on/fit interest measure on page 42 concerns only the app-first shopper subgroup. Self-reported adoption, reasons and preferences do not establish transaction outcomes.
- Rakuten 24 and Google web.dev: Rakuten 24 performance A/B case
web.dev
ReturnStudy details
August 2022 case publication
Japanese daily-necessities retailer. One landing page, one-month 50/50 A/B test of performance optimizations, with no functional or visual differences. Public case does not disclose test dates, sample size or confidence intervals. Multiple delivery changes, not an image-creative experiment.
- Global Payments / Worldpay: Gen Z Driving the Shift from Cards to Digital Wallets, New Research from Global Payments Suggests
investors.globalpayments.com
ReturnStudy details
2025 payment estimates; March 31, 2026 release
Global Payments Report covers 42 markets. Regional shares are ecommerce transaction value, not smartphone share or transaction counts. Generational most-used-payment answers separately use GlobalData Q2 2025 survey of 63,441 consumers across 42 markets; US subset size not disclosed.
- HDE and IFH Köln: Online-Monitor 2026: smartphone shopping, page 35
einzelhandel.de
ReturnStudy details
Full-year 2025; 2026 report
German ecommerce estimates. Device percentages measure sales value; app/web percentages describe smartphone purchases. The page does not disclose a separate app subsample. Own-store and marketplace apps are not separated.
- Adjust: Mobile app trends: 2026 edition
adjust.com
ReturnStudy details
Full-year 2025 comparisons; 2026 report
Provider ecommerce-app performance benchmark. Public preview reports year-over-year session growth but does not disclose its eligible ecommerce sample size. App sessions are not orders, revenue or all mobile shopping.
- Worldpay: Global Payments Report 2025: smartphone share of ecommerce spending
worldpay.com
ReturnStudy details
Full-year 2024; March 11, 2025 release
Worldpay global ecommerce spending estimate, in a report covering 40 selected markets. Smartphone transaction-value share is distinct from wallet share and app use. This is a dated 2024 baseline, not a completed 2026 result.
How this report uses research
This report is an editorial synthesis by Fotogenic AI, updated on October 19, 2026. Source dates describe the underlying evidence. Survey responses, measured activity and forecasts are identified separately. Findings are not combined into a new market average. Multiple pages describing one study are treated as one evidence family.
Create with Fotogenic AI
Give phone shoppers a clear product view
Prepare product imagery in Fotogenic AI, then check the complete item, selected variant and detail views in your mobile gallery.