Holiday shopping statistics
What the last holiday season shows. How to prepare your next campaign.

The completed 2025 season shows what shoppers spent. New 2026 survey research shows when they plan to shop and how they expect to split their budgets. Keep those intentions separate from recorded sales when planning assets, offers and fulfillment.
Key takeaways
Use completed seasons for sales baselines. US online spending reached USD 257.8 billion in November and December 2025, including USD 14.25 billion on Cyber Monday. [1]
Prepare seasonal assets before the peak. Deloitte respondents expected to spend 28% of their 2026 holiday budget by the end of October. [3]
Online remains central to the planned shopping mix: 55% of respondents' intended 2026 retail holiday budget was allocated online. [3]
Key facts at a glance
US online holiday spending in 2025
$257.8Bwas US online spending in November-December 2025.
Completed US online season, Nov-Dec 2025
AdobeShoppers planning an earlier start
22%planned to start holiday shopping earlier than in 2025.
US shopper intentions, Aug-Sep 2026 survey
DeloitteIntended retail holiday budget online
55%of planned retail holiday budget was allocated online.
Intended online retail budget, 2026 survey
DeloitteThanksgiving online spending
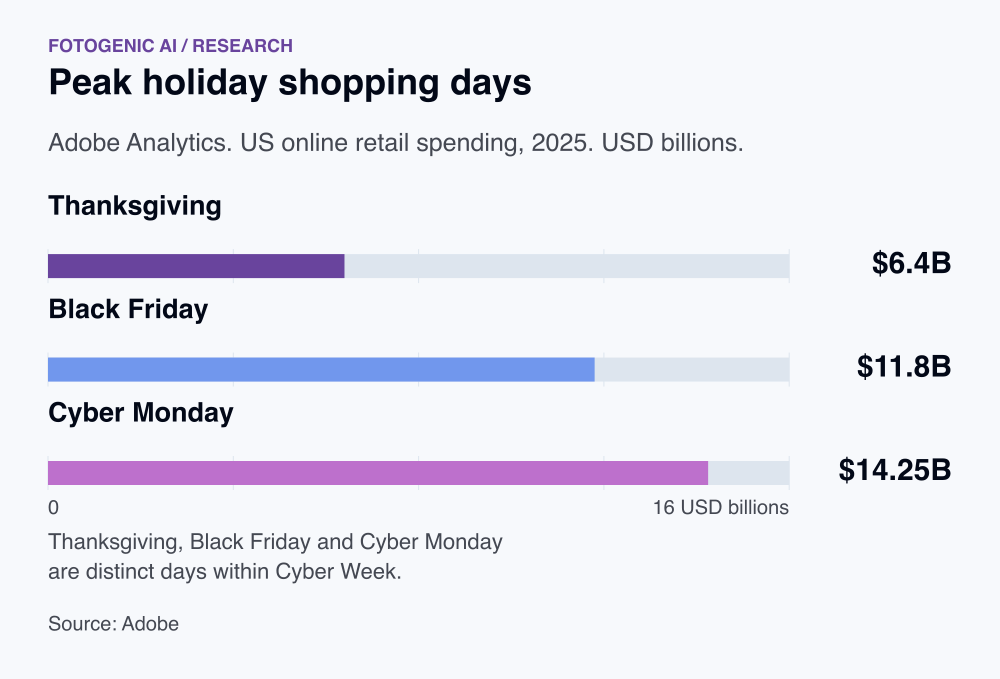
$6.4Bwas US online spending on Thanksgiving 2025.
US online spending, Thanksgiving 2025
AdobeBlack Friday online spending
$11.8Bwas online spending on Black Friday 2025.
US online spending, Black Friday 2025
AdobeCyber Monday online spending
$14.25Bwas online spending on Cyber Monday 2025.
US online spending, Cyber Monday 2025
Adobe
US holiday spending
$257.8B was US online spending in November-December 2025. [1]
This is the completed season reported in January 2026.
6.8% was the year-over-year increase in holiday online spending. [1]
A national seasonal change does not forecast an individual store’s growth.
$14.25B was online spending on Cyber Monday 2025. [1]
A peak-day total is useful for timing, not a typical daily baseline.
$11.8B was online spending on Black Friday 2025. [1]
The two peak days are separate measures, not incremental sales attributable to discounts.
$6.4B was US online spending on Thanksgiving 2025. [1]
One day already included in the broader Cyber Week total.
Retailer activity and seasonal operations
84% of surveyed retailers planned to participate in Black Friday 2025. [2]
A pre-event business plan, not actual participation or a forecast for 2026.
60% reported year-over-year Black Friday sales growth. [2]
Business self-report in the 2025 survey, separate from Adobe’s measured US holiday transactions.
30.9% was the peak electronics discount off listed price. [1]
2025 US holiday peak, not a period-average discount.
4.7% year-over-year growth in returns occurred during December 26-31. [1]
2025 post-Christmas days; return activity, not the proportion of orders returned.
39% of December 23 orders used curbside pickup where retailers offered it. [1]
US holiday analytics. This denominator excludes retailers without the service.
2026 holiday plans and preparation timing
22% planned to start holiday shopping earlier than in 2025. [3]
Page 13, n=3,700. August-September 2026 intentions, not observed start dates or the share shopping before November.
28% of planned holiday budget was expected to be spent by the end of October 2026. [3]
Page 13, n=3,700. Share of intended spending rather than shoppers, measured separately from completed 2025 transactions.
55% of planned retail holiday budget was allocated online. [3]
Page 16, n=3,700. Intended 2026 retail goods spending across devices, not smartphone spending or completed sales.
$1,654 was average intended total holiday spending in Deloitte's 2026 survey. [3]
Includes $988 for retail goods and $666 for holiday activities. It is not average gift spending, an order value or completed household expenditure.
Holiday referral channels
20.4% of US holiday retailer-site revenue was attributed to affiliates and partners in 2025. [1]
This broad channel includes social media influencers and other partners. It is not influencer-only revenue, native social checkout or incremental sales.
Trust in seasonal product evidence
79% looked for customer photos or videos to check whether a holiday review was genuine. [4]
Self-reported verification behavior in Bazaarvoice's March 2026 North American survey, not observed holiday purchases.
Use last season as context, not a forecast
The spending totals refer to the 2025 US holiday period. They are not a completed result for the 2026 season. Use them to understand the scale and concentration of past demand, then build the upcoming plan from current inventory, margins and operational capacity.
Prepare repeatable seasonal assets: turn a product photo into ad creative.
Prepare assets around real offer conditions
Link each seasonal creative to a specific product, available variant and destination. Check that a gift bundle image shows what the customer receives. Keep delivery promises and expiry information consistent across the advertisement, landing page and checkout.
Set a delivery brief for the campaign: plan a three-shot product campaign.
Prepare for early shoppers without confusing plans and sales
Deloitte's 2026 intentions show a reason to prepare approved assets before the main November rush. Set your own dates from product availability and fulfillment cutoffs. Allow a correction window between asset approval, destination checks and distribution.
Keep 2026 intended budgets separate from completed 2025 retailer transactions. Affiliate-and-partner attribution also includes more than influencers. Give each channel a consistent offer and landing product, then reconcile orders and refunds before assessing its contribution.
Use the campaign set generator to plan coordinated seasonal imagery around the actual offer.
Earn trust before the promotion
Customer images can help shoppers verify holiday reviews. Keep those images matched to the product and permissioned for the intended placement. A promotion still needs truthful price, availability and delivery information. Trust preferences do not predict how much a seasonal campaign will sell.
Sequence the campaign around stock and delivery
Work backwards from the actual delivery cutoff and offer expiry. A garment promotion needs the available color and size range confirmed before final assets are prepared. Release the creative only after the destination carries the same product, price and delivery conditions.
| Release dependency | Required decision |
|---|---|
| Inventory | Confirm saleable garments, variants and bundle contents |
| Offer | Approve price, discount basis, dates and exclusions |
| Asset production | Create the product view, seasonal scene and placement crops from that approved offer |
| Destination | Check selected variant, mobile gallery, final cost and payment journey |
| Fulfillment cutoff | Update or stop delivery promises when the actual cutoff passes |
| After the season | Reconcile refunds and retained contribution before reusing the plan |
FAQ
Questions about the research
Adobe measured $257.8 billion in US online spending during November-December 2025, up 6.8% year over year. Cyber Monday contributed $14.25 billion and Black Friday $11.8 billion. The completed-season results were released in 2026 and are a planning baseline for the next season.
Sources and method
- Adobe: 2025 holiday shopping results
news.adobe.com
ReturnStudy details
November-December 2025; January 2026 release
US online retail analytics covering over one trillion visits.
- DHL: E-Commerce Trends Report 2025, Business Edition
group.dhl.com
ReturnStudy details
October 2025 release
Survey of 4,050 ecommerce businesses in 19 markets. Business self-reports and plans, not transaction records or shopper responses.
- Deloitte: 2026 Holiday Retail Survey
deloitte.com
ReturnStudy details
August 26-September 10, 2026 survey; October 15 release
4,000 US consumers surveyed online by an independent research panel; reported whole-sample margin of error +/-2 percentage points. Timing and channel figures on pages 13 and 16 use n=3,700. Intended spending and timing, not completed 2026 transactions. Total holiday budget includes activities as well as retail goods.
- Bazaarvoice: Why authentic holiday content is key to your holiday marketing strategy
bazaarvoice.com
ReturnStudy details
March 2026 survey; April 14, 2026 publication
1,246 North American shoppers aged 18+. Stated holiday trust and purchase preferences. Public article gives no weighting, country split or questionnaire. Does not estimate actual conversion or all generated product photography.
How this report uses research
This report is an editorial synthesis by Fotogenic AI, updated on October 19, 2026. Source dates describe the underlying evidence. Survey responses, measured activity and forecasts are identified separately. Findings are not combined into a new market average. Multiple pages describing one study are treated as one evidence family.
Create with Fotogenic AI
Prepare the next seasonal image set
Create coordinated campaign scenes in Fotogenic AI around the products and offer your holiday campaign will feature.